Basic information
- Phenotype
- HALLMARK_XENOBIOTIC_METABOLISM
- Description
- Enrichment score representing genes involved in the metabolism of xenobiotics. The score was calculated using ssGSEA on the RNA data (Z-score transformed coding genes with expression in at least 50% of the samples in a cohort).
- Source
- http://www.gsea-msigdb.org/gsea/msigdb/cards/HALLMARK_XENOBIOTIC_METABOLISM.html
- Method
- Single sample gene set enrichment analysis (ssGSEA) was performed for each cancer type using gene-wise Z-scores of the RNA expression data (RSEM) for the MSigDB Hallmark gene sets v7.0 (PMID: 26771021) via the ssGSEA2.0 R package (PMID: 30563849). RNA data were filtered to coding genes with < 50% 0 expression. (Parameters: sample.norm.type="rank", weight=0.75, statistic="area.under.RES", nperm=1000, min.overlap=10). Pathway activity scores are normalized enrichment scores from ssGSEA.
- Genes
-
- ABCC3
- ABCD2
- ABHD6
- ACO2
- ACOX1
- ACOX2
- ACOX3
- ACP1
- ACP2
- ACSM1
- ADH1C
- ADH5
- ADH7
- AHCY
- AKR1C2
- AKR1C3
- ALAS1
- ALDH2
- ALDH3A1
- ALDH9A1
- ANGPTL3
- AOX1
- AP4B1
- APOE
- AQP9
- ARG1
- ARG2
- ARPP19
- ASL
- ATOH8
- ATP2A2
- BCAR1
- BCAT1
- BLVRB
- BPHL
- CA2
- CASP6
- CAT
- CBR1
- CCL25
- CD36
- CDA
- CDO1
- CES1
- CFB
- CNDP2
- COMT
- CROT
- CRP
- CSAD
- CYB5A
- CYFIP2
- CYP17A1
- CYP1A1
- CYP1A2
- CYP26A1
- CYP27A1
- CYP2C18
- CYP2E1
- CYP2J2
- CYP2S1
- CYP4F2
- DCXR
- DDAH2
- DDC
- DDT
- DHPS
- DHRS1
- DHRS7
- ECH1
- ELOVL5
- ENPEP
- ENTPD5
- EPHA2
- EPHX1
- ESR1
- ETFDH
- ETS2
- F10
- F11
- FABP1
- FAH
- FAS
- FBLN1
- FBP1
- FETUB
- FMO1
- FMO3
- G6PC
- GABARAPL1
- GAD1
- GART
- GCH1
- GCKR
- GCLC
- GCNT2
- GNMT
- GSR
- GSS
- GSTA3
- GSTM4
- GSTO1
- GSTT2
- HACL1
- HES6
- HGFAC
- HMOX1
- HNF4A
- HPRT1
- HRG
- HSD11B1
- HSD17B2
- ID2
- IDH1
- IGF1
- IGFBP1
- IGFBP4
- IL1R1
- IRF8
- ITIH1
- ITIH4
- JUP
- KARS1
- KYNU
- LCAT
- LEAP2
- LONP1
- LPIN2
- MAN1A1
- MAOA
- MARCHF6
- MBL2
- MCCC2
- MPP2
- MT2A
- MTHFD1
- NDRG2
- NFS1
- NINJ1
- NMT1
- NPC1
- NQO1
- PAPSS2
- PC
- PDK4
- PDLIM5
- PEMT
- PGD
- PGRMC1
- PINK1
- PLG
- PMM1
- POR
- PPARD
- PROS1
- PSMB10
- PTGDS
- PTGES
- PTGES3
- PTGR1
- PTS
- PYCR1
- RAP1GAP
- RBP4
- REG1A
- RETSAT
- SAR1B
- SERPINA6
- SERPINE1
- SERTAD1
- SHMT2
- SLC12A4
- SLC1A5
- SLC22A1
- SLC35B1
- SLC35D1
- SLC46A3
- SLC6A12
- SLC6A6
- SMOX
- SPINT2
- SSR3
- TAT
- TDO2
- TGFB2
- TKFC
- TMBIM6
- TMEM176B
- TMEM97
- TNFRSF1A
- TPST1
- TTPA
- TYR
- UGDH
- UPB1
- UPP1
- VNN1
- VTN
- XDH
- More...
Gene association
Number of significant genes with P-value ≤ 10-6 for each cohorts are summarized in bar plots. The scatter plot highlights significant associations diven by protein rather than mRNA abundance.
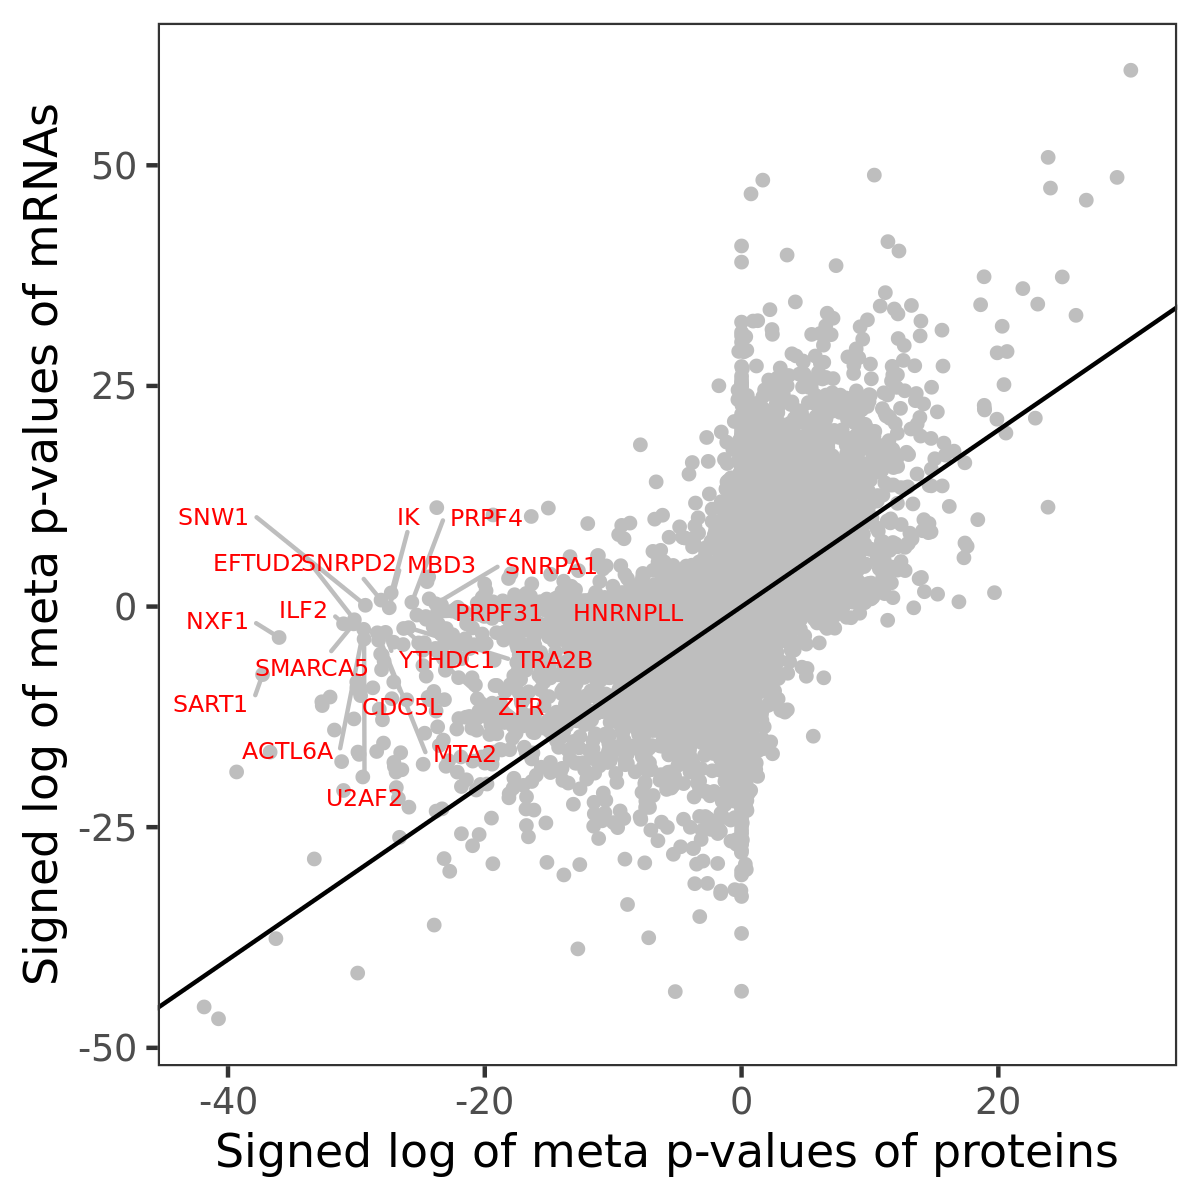
Association of protein abundance of genes
| Signed p-values | |||||||||||
|---|---|---|---|---|---|---|---|---|---|---|---|
| Gene | Meta P | BRCA | CCRCC | COAD | GBM | HNSCC | LSCC | LUAD | OV | PDAC | UCEC |
Gene set enrichment analysis
Submit genes and the common logarithm of the p-values of their association with HALLMARK_XENOBIOTIC_METABOLISM to WebGestalt.
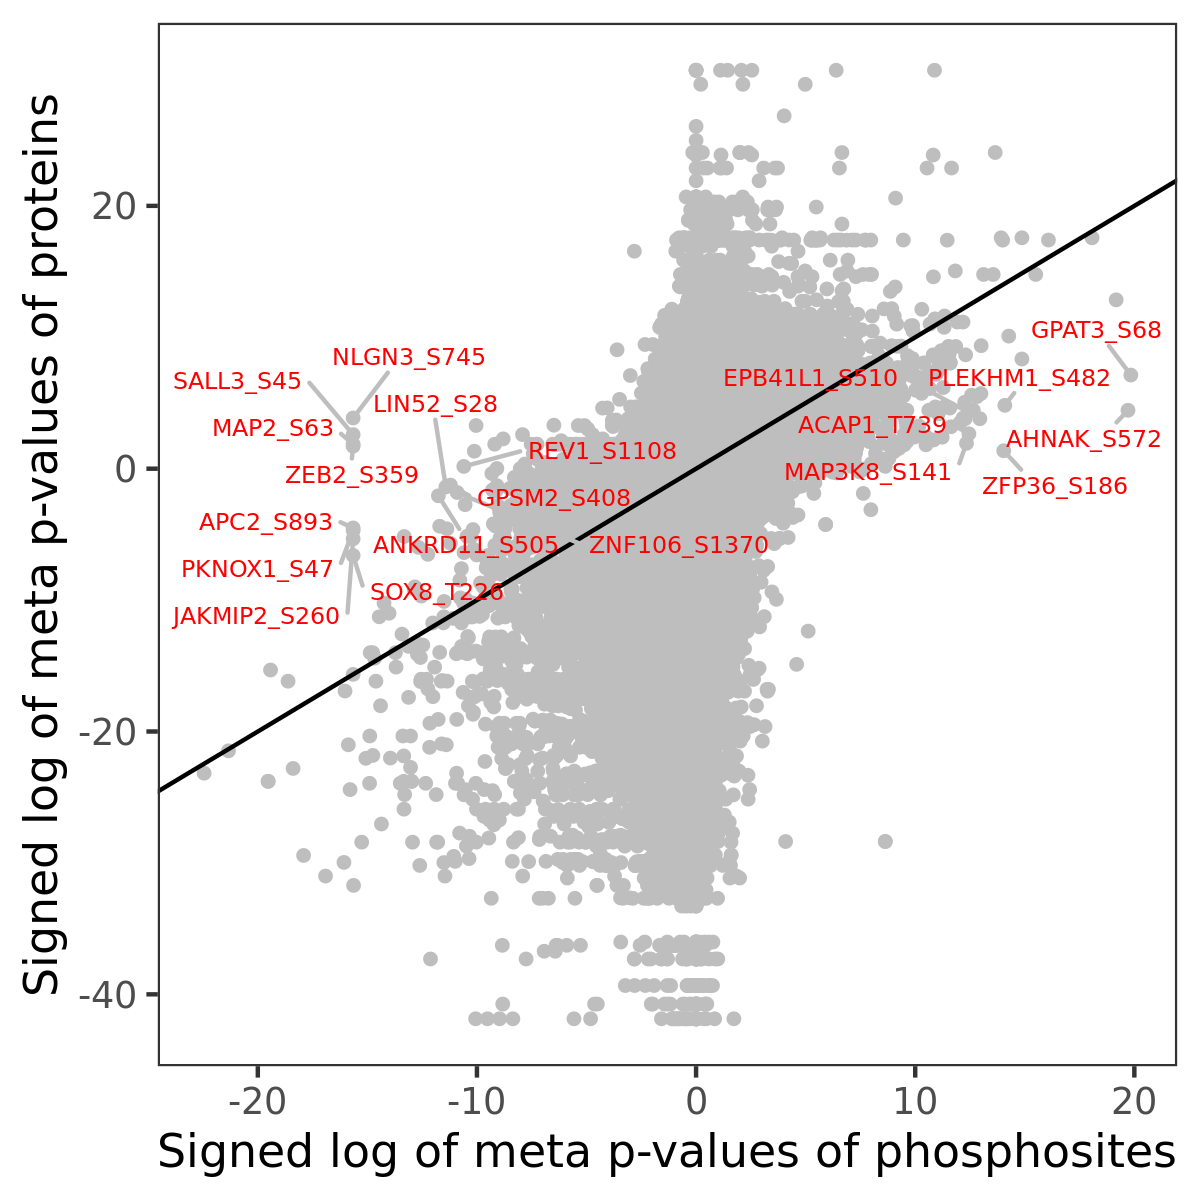
Phosphosite association
Number of significant genes with P-value ≤ 10-6 for each cohorts are summarized in the bar plot. The scatter plot highlights significant associations diven by phosphorylation rather than protein abundance.
| Signed p-values | |||||||||||||
|---|---|---|---|---|---|---|---|---|---|---|---|---|---|
| Gene | Protein | Site | Meta P | BRCA | CCRCC | COAD | GBM | HNSCC | LSCC | LUAD | OV | PDAC | UCEC |
Gene set enrichment analysis
Submit phosphorylation sites and the common logarithm of the p-values of their association with HALLMARK_XENOBIOTIC_METABOLISM to WebGestalt.