Basic information
- Phenotype
- PROGENy: TNFa
- Description
- Score representing the activity of the TNFa pathway. It was calculated using the PROGENy tool on the RNA data (genes with mean FPKM expression >0).
- Source
- https://www.nature.com/articles/s41467-017-02391-6; https://www.sciencedirect.com/science/article/abs/pii/S1874939919302287?via%3Dihub
- Method
- The PROGENy scores were inferred using the R package progeny (V1.10.0) (PMID: 29295995) with default parameters using the RNA expression data (FPKM). Genes with mean expression = 0 in a cohort were removed from the analysis.
- Genes
-
- ANKLE2
- APBA3
- B4GALT1
- BCL2A1
- BDKRB1
- BID
- BIRC2
- BIRC3
- BMP2
- C11orf96
- C1QTNF1
- C3
- CCL2
- CCL20
- CD83
- CFB
- CFLAR
- CLDN1
- CSF2
- CSF3
- CTHRC1
- CTSS
- CXCL1
- CXCL2
- CXCL3
- CXCL5
- CXCL6
- CXCL8
- CYLD
- DRAM1
- DTX2
- EDN1
- EFNA1
- ETS1
- GPR176
- GSAP
- ICAM1
- IFNAR2
- IFNGR2
- IGFL1
- IKBKE
- IL15
- IL1RN
- IL32
- IL36G
- IL6
- INHBA
- IRF1
- Array
- KRT6B
- LTB
- MMP10
- MMP12
- MMP13
- MMP9
- MRGPRX3
- NECAP2
- NFKB1
- NFKB2
- NFKBIA
- NFKBIB
- NFKBIE
- NINJ1
- NKX3-1
- PDPN
- PLAU
- PPP4R4
- PTX3
- RELB
- RHBDL2
- RHCG
- RIPK2
- RND1
- SDC4
- SERPINA3
- SLC2A6
- SLC41A2
- SOD2
- SOD2_ENSG00000285441
- SRGN
- TAPBP
- TICAM1
- TIFA
- TLR2
- TMEM217
- TNFAIP1
- TNFAIP2
- TNFAIP3
- TNIP1
- TNIP2
- TRAF1
- TRIM47
- TYMP
- UBE2Z
- USP43
- UXS1
- WTAP
- More...
Gene association
Number of significant genes with P-value ≤ 10-6 for each cohorts are summarized in bar plots. The scatter plot highlights significant associations diven by protein rather than mRNA abundance.
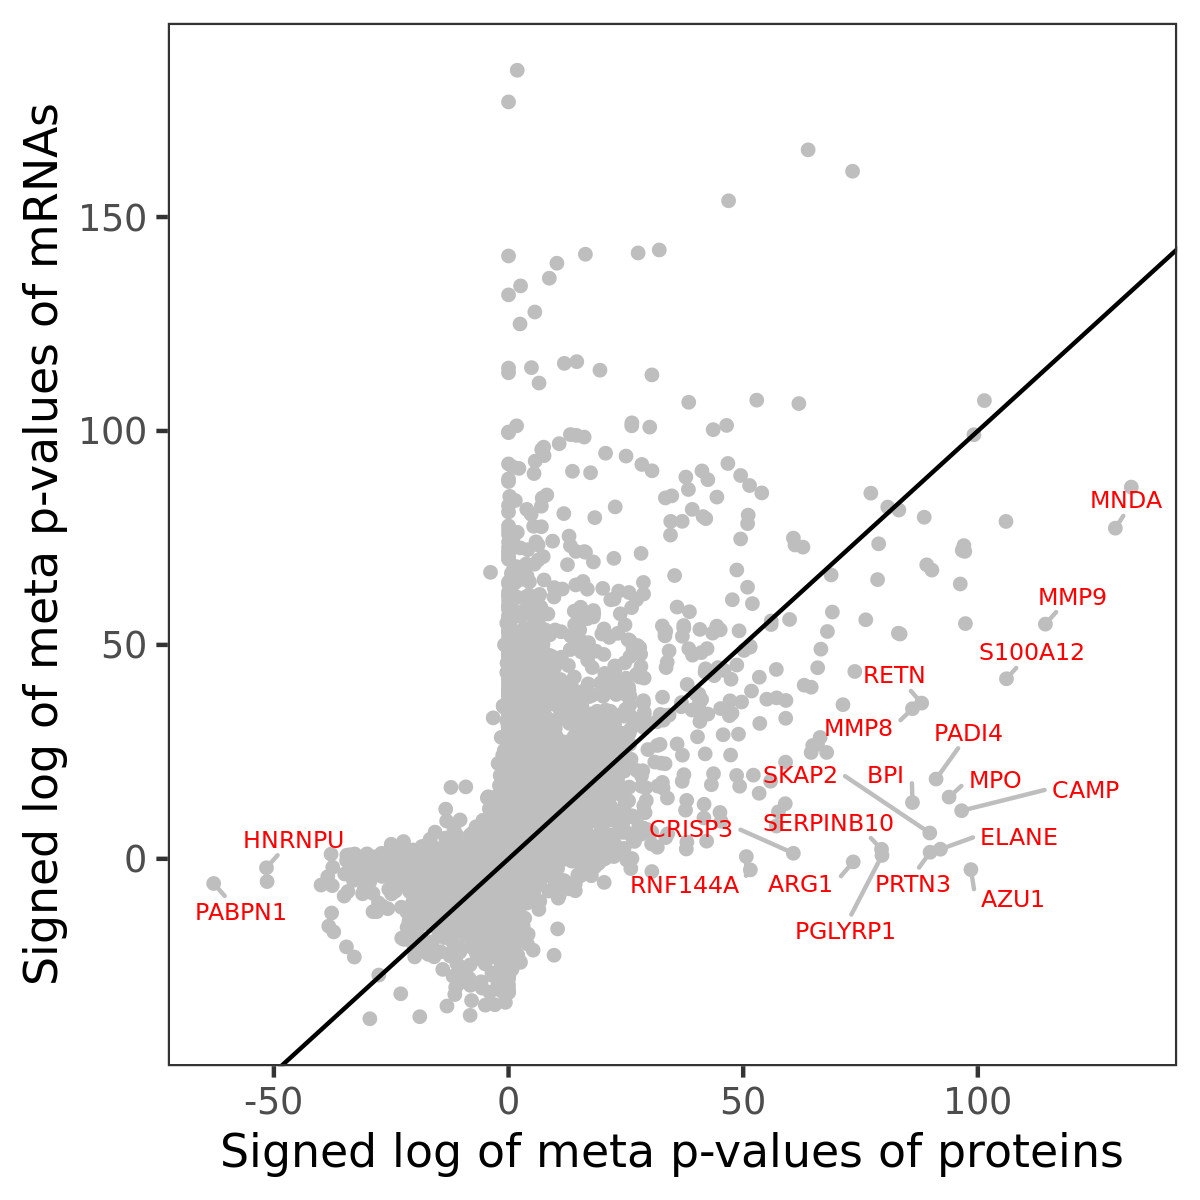
Association of protein abundance of genes
| Signed p-values | |||||||||||
|---|---|---|---|---|---|---|---|---|---|---|---|
| Gene | Meta P | BRCA | CCRCC | COAD | GBM | HNSCC | LSCC | LUAD | OV | PDAC | UCEC |
Gene set enrichment analysis
Submit genes and the common logarithm of the p-values of their association with PROGENy: TNFa to WebGestalt.
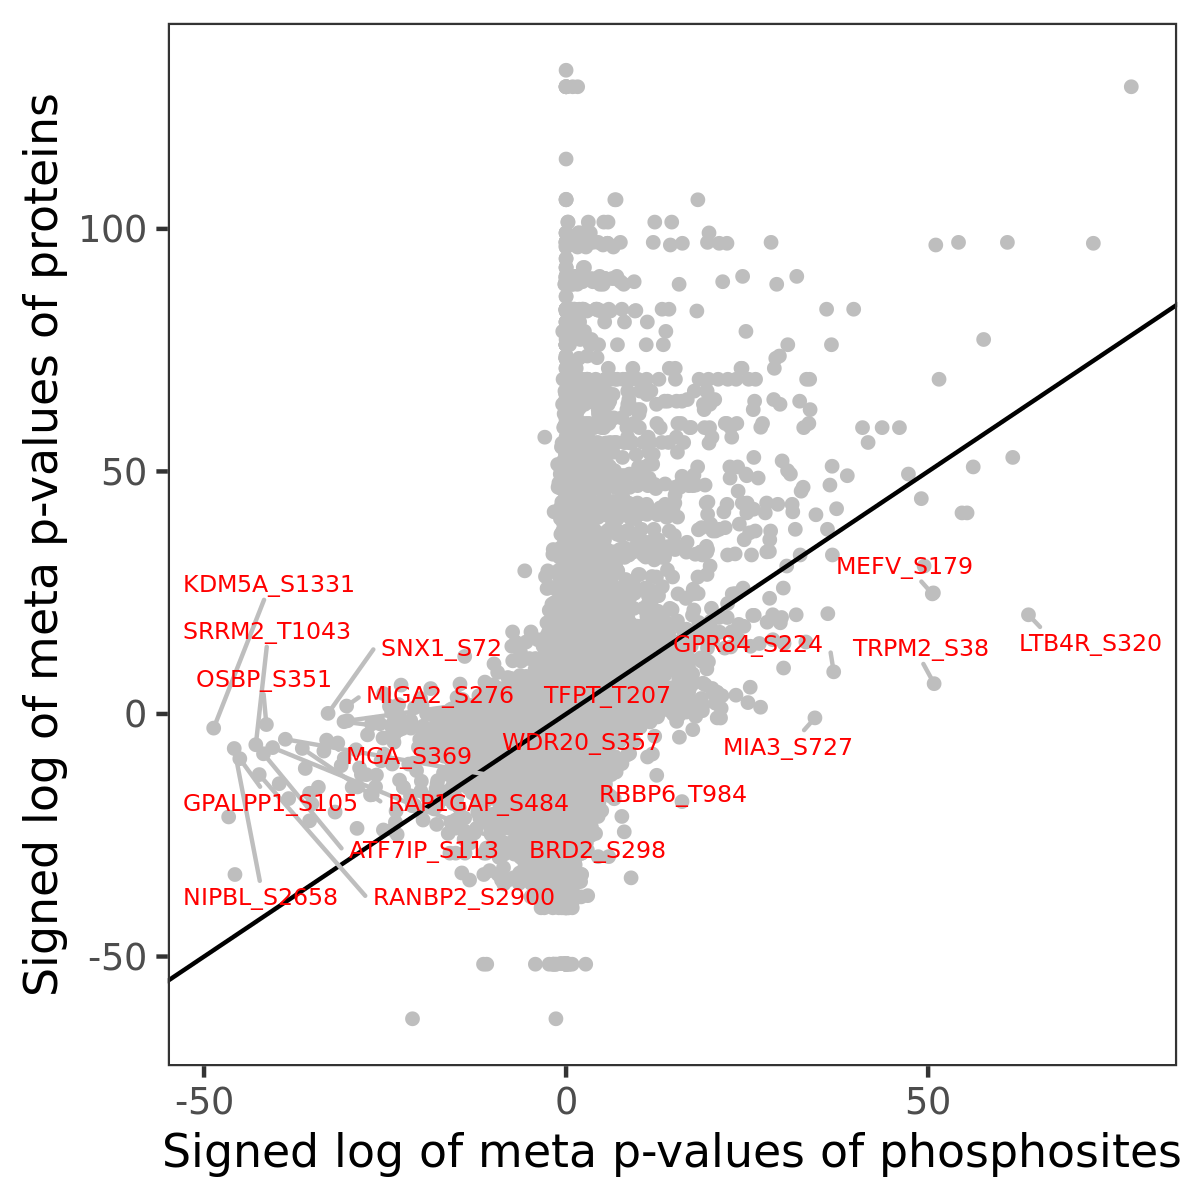
Phosphosite association
Number of significant genes with P-value ≤ 10-6 for each cohorts are summarized in the bar plot. The scatter plot highlights significant associations diven by phosphorylation rather than protein abundance.
| Signed p-values | |||||||||||||
|---|---|---|---|---|---|---|---|---|---|---|---|---|---|
| Gene | Protein | Site | Meta P | BRCA | CCRCC | COAD | GBM | HNSCC | LSCC | LUAD | OV | PDAC | UCEC |
Gene set enrichment analysis
Submit phosphorylation sites and the common logarithm of the p-values of their association with PROGENy: TNFa to WebGestalt.