Basic information
- Phenotype
- cibersort: T cell gamma delta
- Description
- Estimated fraction of gamma-delta T cells in the tumor compared to 21 other immune cells defined by CIBERSORT based on RNA expression data.
- Source
- https://www.nature.com/articles/nmeth.3337
- Method
- The R package immunedeconv (V2.0.4) (PMID: 31510660) was used to perform immune cell deconvolution using RNA expression data (TPM). CIBERSORT (PMID: 25822800) was performed in the ‘abs’ mode.
- Genes
-
- APOBEC3A
- APOL3
- C3AR1
- CCR2
- CD244
- CD37
- CD3E
- CD3G
- CD8A
- CRTAM
- CXCR1
- CXCR6
- FPR1
- GPR18
- GZMM
- HCK
- IL18R1
- IL4R
- IRF8
- LAG3
- LAIR2
- LIME1
- LST1
- LY86
- LY9
- MAP4K1
- NCF2
- NCR3
- NPIPB15
- P2RX5
- PIK3IP1
- PLEKHF1
- PLEKHG3
- PRR5L
- PTPRCAP
- RASGRP2
- RNASE6
- SAMSN1
- SH2D1A
- SIRPG
- SIT1
- SLAMF1
- SPOCK2
- TBX21
- TCF7
- TRAT1
- TRIB2
- VNN2
- ZAP70
- Array
- APOBEC3G
- BCL11B
- CCL4
- Array
- ADRB2
- CCL5
- CCR5
- CD160
- CD2
- CD247
- CD27
- Array
- CD300A
- CD3D
- CD69
- CD96
- CST7
- CTSW
- DUSP2
- FCN1
- GNLY
- GPR171
- GPR65
- GZMA
- GZMB
- GZMH
- GZMK
- IL18RAP
- IL2RB
- IL7R
- ITK
- KLRB1
- KLRD1
- KLRF1
- KLRG1
- KLRK1
- LAT
- Array
- LCK
- LTB
- MNDA
- MS4A6A
- NKG7
- PRF1
- PTGER2
- PVRIG
- S100A12
- SELL
- SKAP1
- More...
Gene association
Number of significant genes with P-value ≤ 10-6 for each cohorts are summarized in bar plots. The scatter plot highlights significant associations diven by protein rather than mRNA abundance.
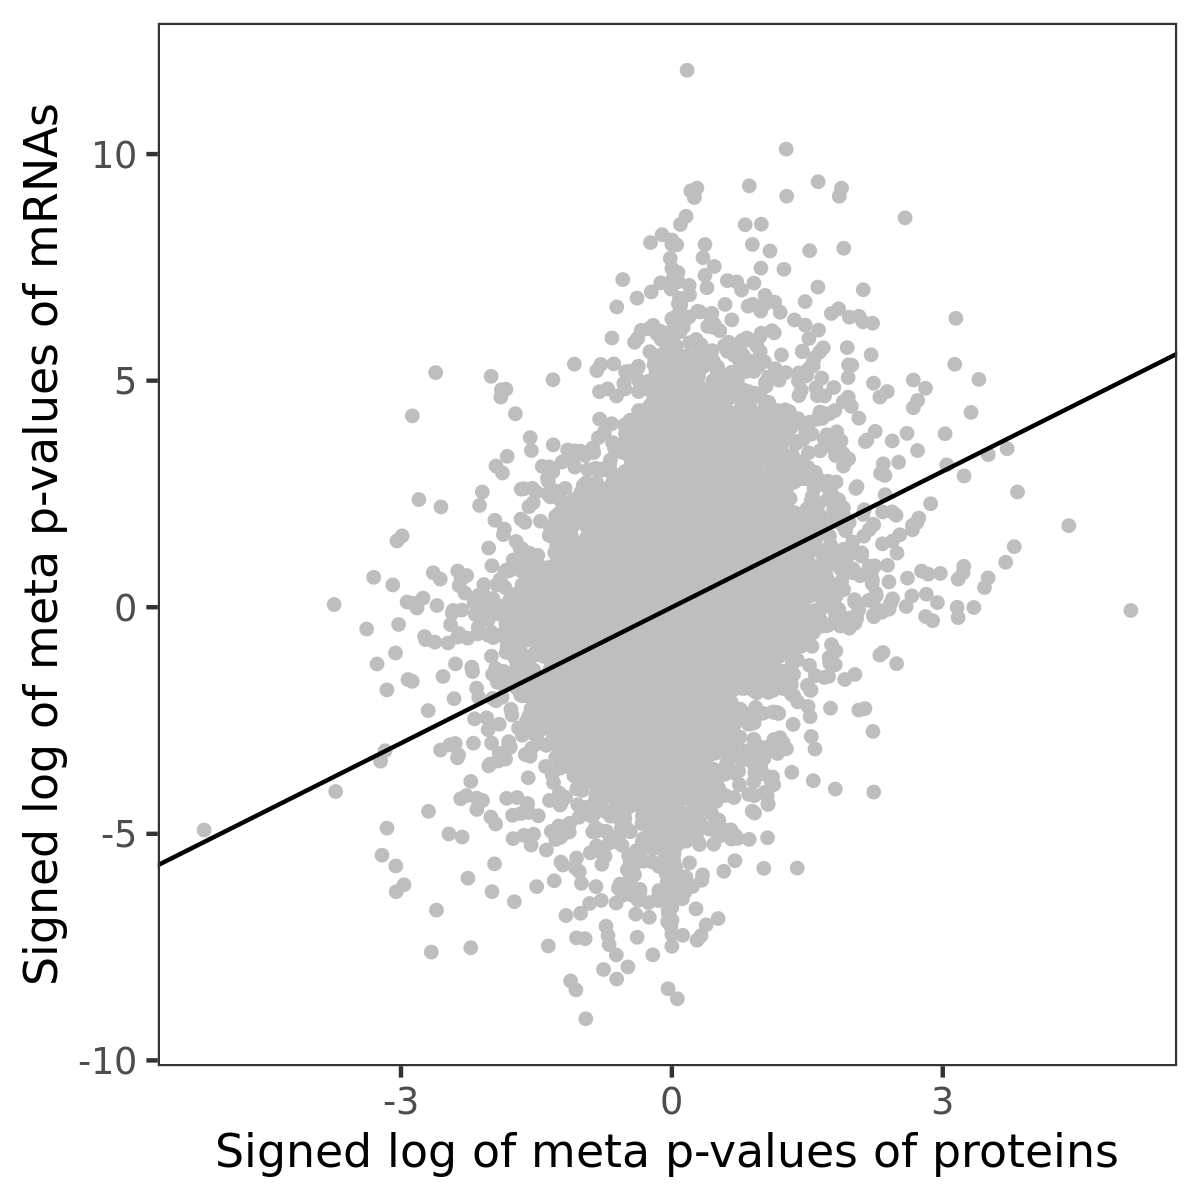
Association of protein abundance of genes
Signed p-values | ||||||||||||
|---|---|---|---|---|---|---|---|---|---|---|---|---|
Gene | Meta P | BRCA | CCRCC | COAD | GBM | HNSCC | LSCC | LUAD | OV | PDAC | UCEC | |
| No matching records found | ||||||||||||
Gene set enrichment analysis
Submit genes and the common logarithm of the p-values of their association with cibersort: T cell gamma delta to WebGestalt.
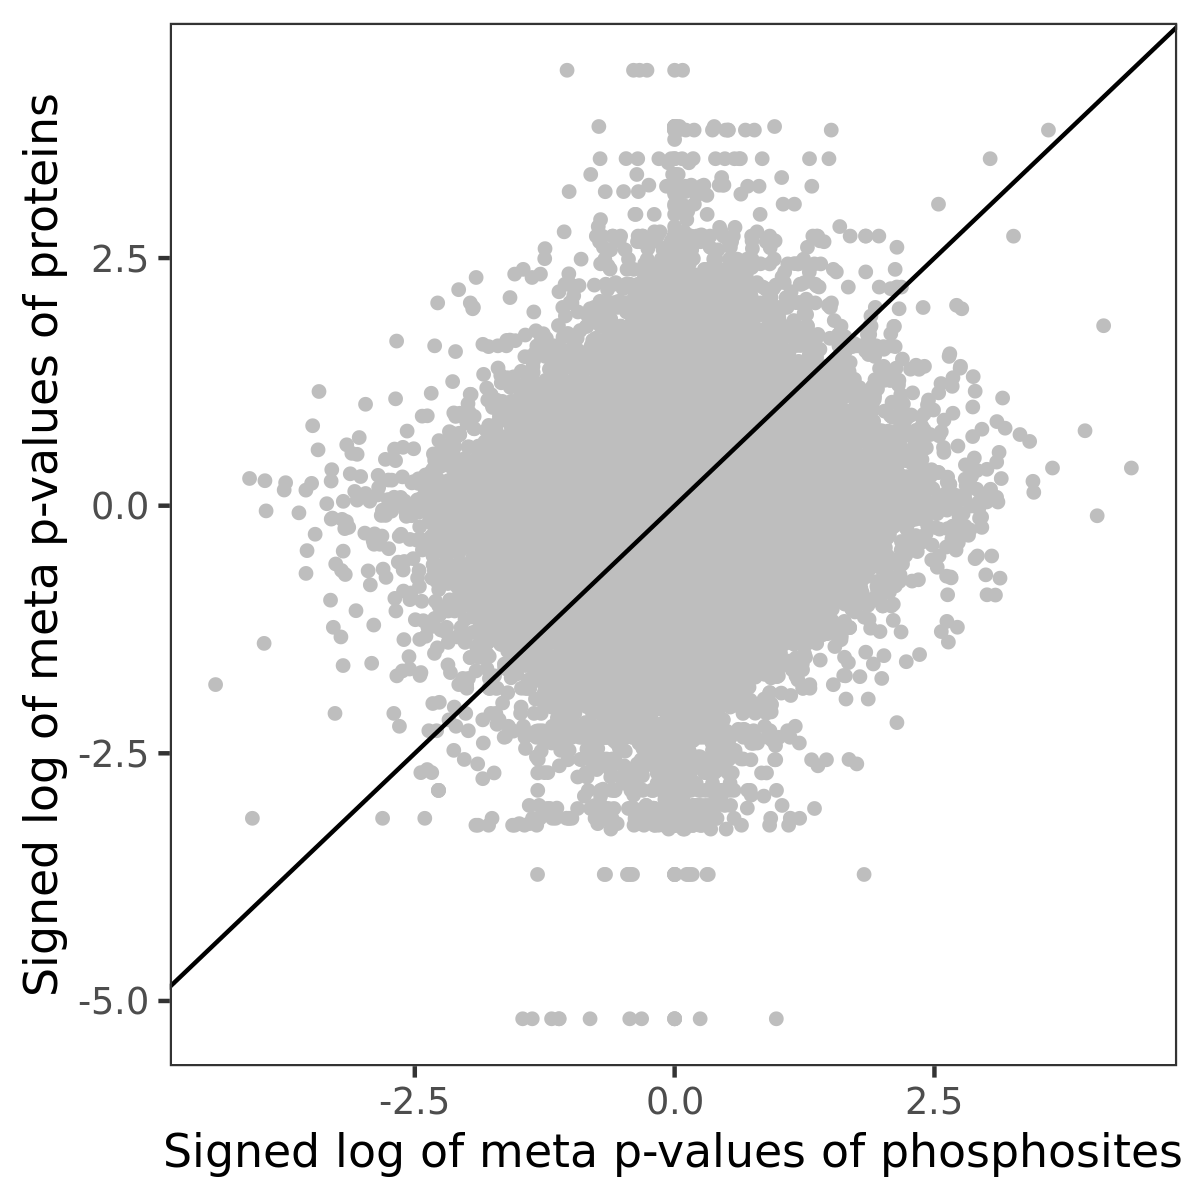
Phosphosite association
Number of significant genes with P-value ≤ 10-6 for each cohorts are summarized in the bar plot. The scatter plot highlights significant associations diven by phosphorylation rather than protein abundance.
Signed p-values | |||||||||||||
|---|---|---|---|---|---|---|---|---|---|---|---|---|---|
Gene | Protein | Site | Meta P | BRCA | CCRCC | COAD | GBM | HNSCC | LSCC | LUAD | OV | PDAC | UCEC |
| No matching records found | |||||||||||||
Gene set enrichment analysis
Submit phosphorylation sites and the common logarithm of the p-values of their association with cibersort: T cell gamma delta to WebGestalt.