Basic information
- Phenotype
- xcell: Cancer associated fibroblast
- Description
- Enrichment score inferring the proportion of cancer-associated fibroblasts in the tumor derived from RNA data using the xCell tool.
- Source
- https://genomebiology.biomedcentral.com/articles/10.1186/s13059-017-1349-1
- Method
- The R package immunedeconv (V2.0.4) (PMID: 31510660) was used to perform immune cell deconvolution using RNA expression data (TPM).
- Genes
-
- ACBD3
- ACTR10
- ADAMTS12
- ADD1
- ADH1B
- ADH5
- ADI1
- ADM2
- AHNAK
- ALDH9A1
- AMOTL2
- ANKRD40
- ANXA11
- AP2M1
- ARF4
- ARHGAP6
- ARL1
- ASPA
- ASPN
- ATG9A
- ATP13A1
- ATP2A2
- ATXN2
- B4GALT2
- BAD
- BAG2
- BMPR1A
- C11orf95
- C6orf120
- C6orf62
- C7
- C7orf25
- CACNA1C
- CAMLG
- CAND1
- CASS4
- CCDC90B
- CGGBP1
- CIRBP
- CLEC3B
- COL14A1
- CORIN
- CSF1
- CSNK1A1
- CSNK1G3
- CSTF2T
- CYBA
- CYP20A1
- DCTD
- DDX19A
- DEK
- DNAJC13
- DNPEP
- DPT
- DPY19L4
- DSTN
- DUT
- ECT2
- EDA2R
- ELN
- EMILIN1
- EML3
- ETF1
- EXOC1
- FAIM2
- FBXL8
- FGF7
- FKTN
- FMO2
- FRS2
- FTL
- FTO
- GANAB
- GDF5
- GGPS1
- GOLGA1
- GOLGA4
- GPATCH2
- GPR137
- GPR85
- GRIA1
- GRIA3
- GSTM5
- HAND2
- HDAC5
- HDAC7
- HEXA
- HIC1
- HIF1A
- HLCS
- HPS1
- HSPB6
- HSPB7
- HTR2A
- HTR2B
- ICMT
- IDUA
- IMPACT
- IPO5
- ISLR
- ITIH3
- JAK3
- KDELR1
- KDELR2
- KIAA1614
- KIF26B
- KRT19
- LAPTM4A
- LGALS1
- LMOD1
- LRRC42
- LSM6
- LTBR
- LTC4S
- MAGEF1
- MAP4K5
- MASP1
- MBTPS2
- MFSD5
- MGMT
- MGST3
- MIF
- MKRN2
- MMP17
- MMP19
- MOSPD3
- MPHOSPH10
- MPZL1
- MRPL12
- MTHFD2
- MYH1
- MYH2
- MYL12B
- MYOF
- NDST2
- NFATC4
- NFE2L2
- NGRN
- NPTN
- OCRL
- P4HB
- PAPPA2
- PCDHGA11
- PDE4A
- PFDN5
- PGK1
- PIK3R2
- PODNL1
- POLR2E
- POMGNT1
- PPIB
- PRDX4
- PRDX6
- PRKG1
- PRKG2
- PRPH2
- PTGIR
- RAB11FIP2
- RAB3GAP1
- RAD23B
- RASA2
- RASL12
- RCN2
- RNASEH1
- RNF14
- RNF4
- RNF41
- RNH1
- ROM1
- RPL23
- RPL37A
- RRAS2
- RYK
- S1PR2
- SAR1A
- SCAMP1
- SCRN1
- SEC22A
- SEC24A
- SEC61A1
- SGCD
- SGCG
- SH3BP2
- SHMT2
- SHQ1
- SIM1
- SIX5
- SLC25A32
- SLC35A2
- SLC35A5
- SLC35E1
- SMAD5
- SNAPC2
- SNED1
- SNTB2
- SNX19
- SPAG16
- SPATA7
- SPIN1
- SPTLC1
- ST7L
- SVEP1
- TADA2A
- TBC1D17
- TBL2
- TBX5
- TCEAL4
- TCF21
- TEX261
- TFDP1
- TFG
- THAP10
- TM2D1
- TMED10
- TMED9
- TMEM115
- TMEM165
- TNFRSF12A
- TNXB
- TOR1AIP1
- TOR1AIP2
- TPD52L2
- TRIM32
- TSPYL1
- TTC26
- TXLNA
- TXNL4B
- UBE2D4
- UBE3B
- VCL
- VIM
- WDR73
- WNT2
- XPOT
- YAP1
- ZBTB1
- ZC3H14
- ZCCHC4
- ZFPL1
- ZFYVE9
- ZMYM4
- ZNF32
- ZNF358
- ZNF444
- ZNF446
- ZNF471
- ZNF771
- More...
Gene association
Number of significant genes with P-value ≤ 10-6 for each cohorts are summarized in bar plots. The scatter plot highlights significant associations diven by protein rather than mRNA abundance.
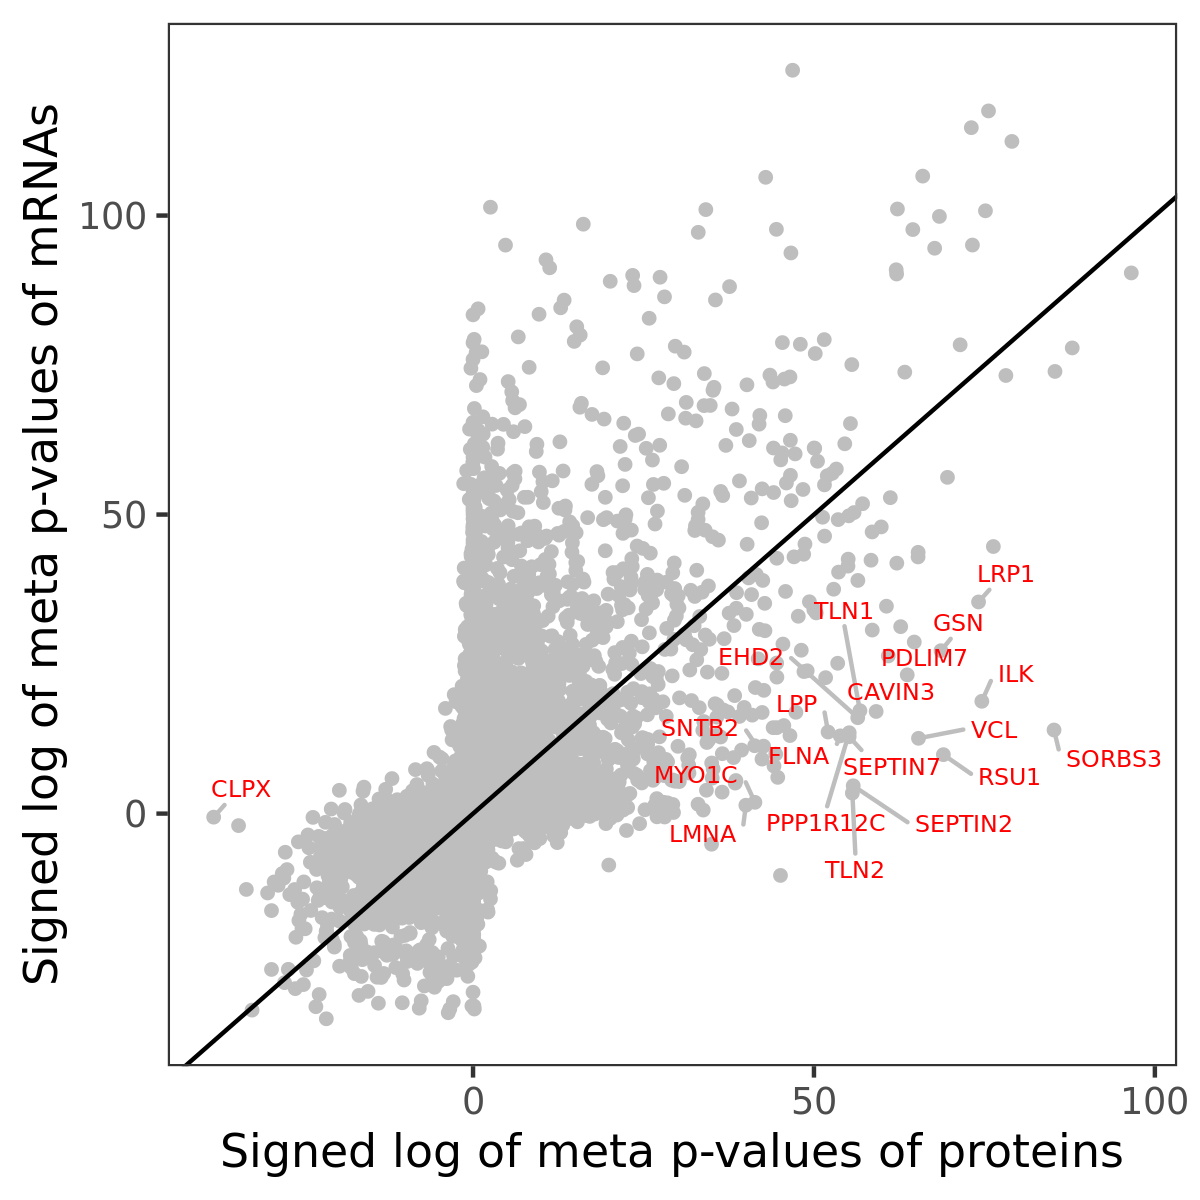
Association of protein abundance of genes
| Signed p-values | |||||||||||
|---|---|---|---|---|---|---|---|---|---|---|---|
| Gene | Meta P | BRCA | CCRCC | COAD | GBM | HNSCC | LSCC | LUAD | OV | PDAC | UCEC |
Gene set enrichment analysis
Submit genes and the common logarithm of the p-values of their association with xcell: Cancer associated fibroblast to WebGestalt.
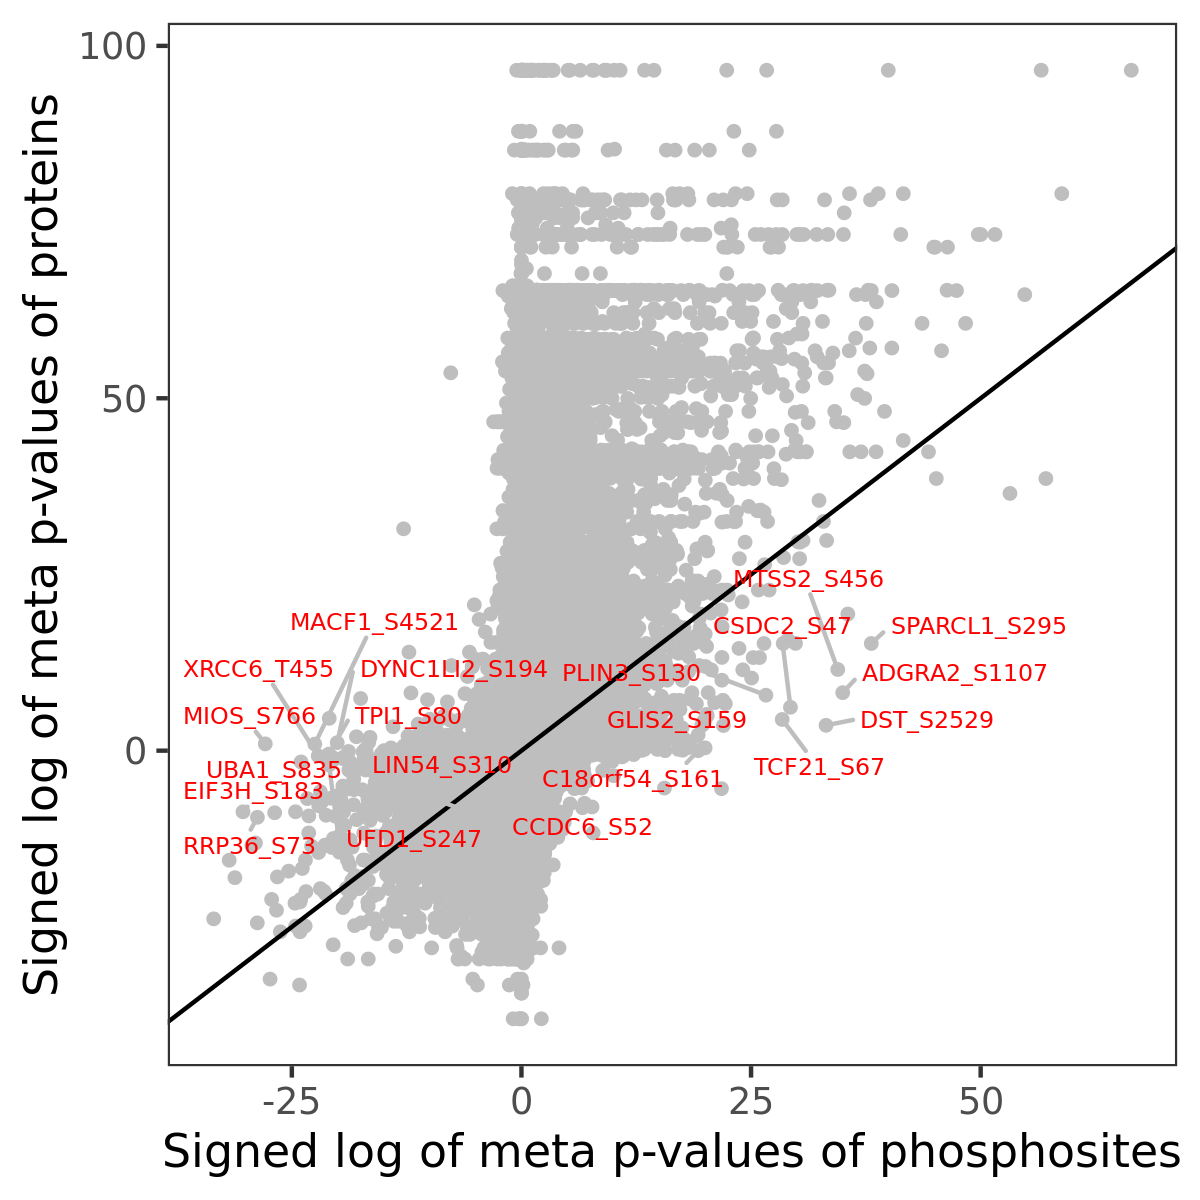
Phosphosite association
Number of significant genes with P-value ≤ 10-6 for each cohorts are summarized in the bar plot. The scatter plot highlights significant associations diven by phosphorylation rather than protein abundance.
| Signed p-values | |||||||||||||
|---|---|---|---|---|---|---|---|---|---|---|---|---|---|
| Gene | Protein | Site | Meta P | BRCA | CCRCC | COAD | GBM | HNSCC | LSCC | LUAD | OV | PDAC | UCEC |
Gene set enrichment analysis
Submit phosphorylation sites and the common logarithm of the p-values of their association with xcell: Cancer associated fibroblast to WebGestalt.