Basic information
- Phenotype
- xcell: T cell CD4+ effector memory
- Description
- Enrichment score inferring the proportion of effector memory CD4+ T cells in the tumor derived from RNA data using the xCell tool.
- Source
- https://genomebiology.biomedcentral.com/articles/10.1186/s13059-017-1349-1
- Method
- The R package immunedeconv (V2.0.4) (PMID: 31510660) was used to perform immune cell deconvolution using RNA expression data (TPM).
- Genes
-
- AIRE
- APBA3
- ARAF
- ARHGAP15
- ASB6
- BAG3
- BCAS2
- BRPF1
- C19orf53
- CABIN1
- CAPZB
- CCNT1
- CCR2
- CCR4
- CCR6
- CCR8
- CCR9
- CD2
- CD28
- CD3E
- CD4
- CD40LG
- CD48
- CD5
- CD52
- CD6
- CDC14A
- CDC37
- CDC73
- CGRRF1
- CLIP1
- CNOT1
- COG4
- COL5A3
- COLQ
- COPB1
- COPS6
- CTLA4
- CXCR3
- DCTN6
- DDX56
- DLEC1
- DNAI2
- DNAJB1
- DYNC1H1
- DYNLT1
- E4F1
- EIF3A
- EIF3G
- ELAC2
- EMD
- ERN1
- ESYT1
- FBXL8
- FBXO31
- FXYD7
- FYCO1
- GALNT8
- GIPC1
- GIT1
- GOLGA7
- GOLGB1
- GORASP2
- GPI
- GPR15
- GPR171
- GPR25
- GPSM3
- GRM3
- GZMK
- HAUS3
- HMGN4
- IBTK
- ICOS
- IDE
- IK
- IL10RA
- IL5RA
- ITGB7
- ITIH4
- ITK
- JMJD6
- JTB
- KBTBD4
- KLRB1
- KRT1
- LTA
- LTK
- LZTR1
- MAML1
- MAPKAPK5
- MARK3
- MCF2L2
- MKNK1
- MORC2
- MTMR6
- MUS81
- MYO16
- N4BP1
- NCDN
- NCK2
- NDUFB2
- NECAP2
- NFKB1
- NFRKB
- NOL6
- NSD1
- OSM
- PABPC3
- PDCD1
- PGK1
- PLCL1
- PSMD9
- PVRIG
- RABGGTA
- RANBP9
- RBL1
- RBM10
- RGS1
- RIC8A
- RIPK1
- RNF7
- RNPEPL1
- RPL38
- RPN2
- RPS21
- RRM1
- RRS1
- RWDD1
- S100A11
- SAMSN1
- SEC24C
- SELPLG
- SF3A1
- SF3B2
- SIT1
- SLAMF1
- SLC35B1
- SLC38A10
- SLC9A6
- SMAP1
- SMARCC2
- SOS1
- SPSB3
- SPTAN1
- SRRT
- SSR2
- STUB1
- STX17
- TAF10
- TAF1B
- TBCC
- TCF20
- TCF25
- THUMPD1
- TKTL1
- TNFRSF4
- TNFSF8
- TNIP2
- TPO
- TRADD
- TRAF1
- TRAPPC2L
- TRAPPC4
- TRAT1
- TUFM
- UBASH3A
- UBIAD1
- USP10
- USP36
- VPS54
- XPC
- ZC3HAV1
- ZFYVE9
- ZNF394
- More...
Gene association
Number of significant genes with P-value ≤ 10-6 for each cohorts are summarized in bar plots. The scatter plot highlights significant associations diven by protein rather than mRNA abundance.
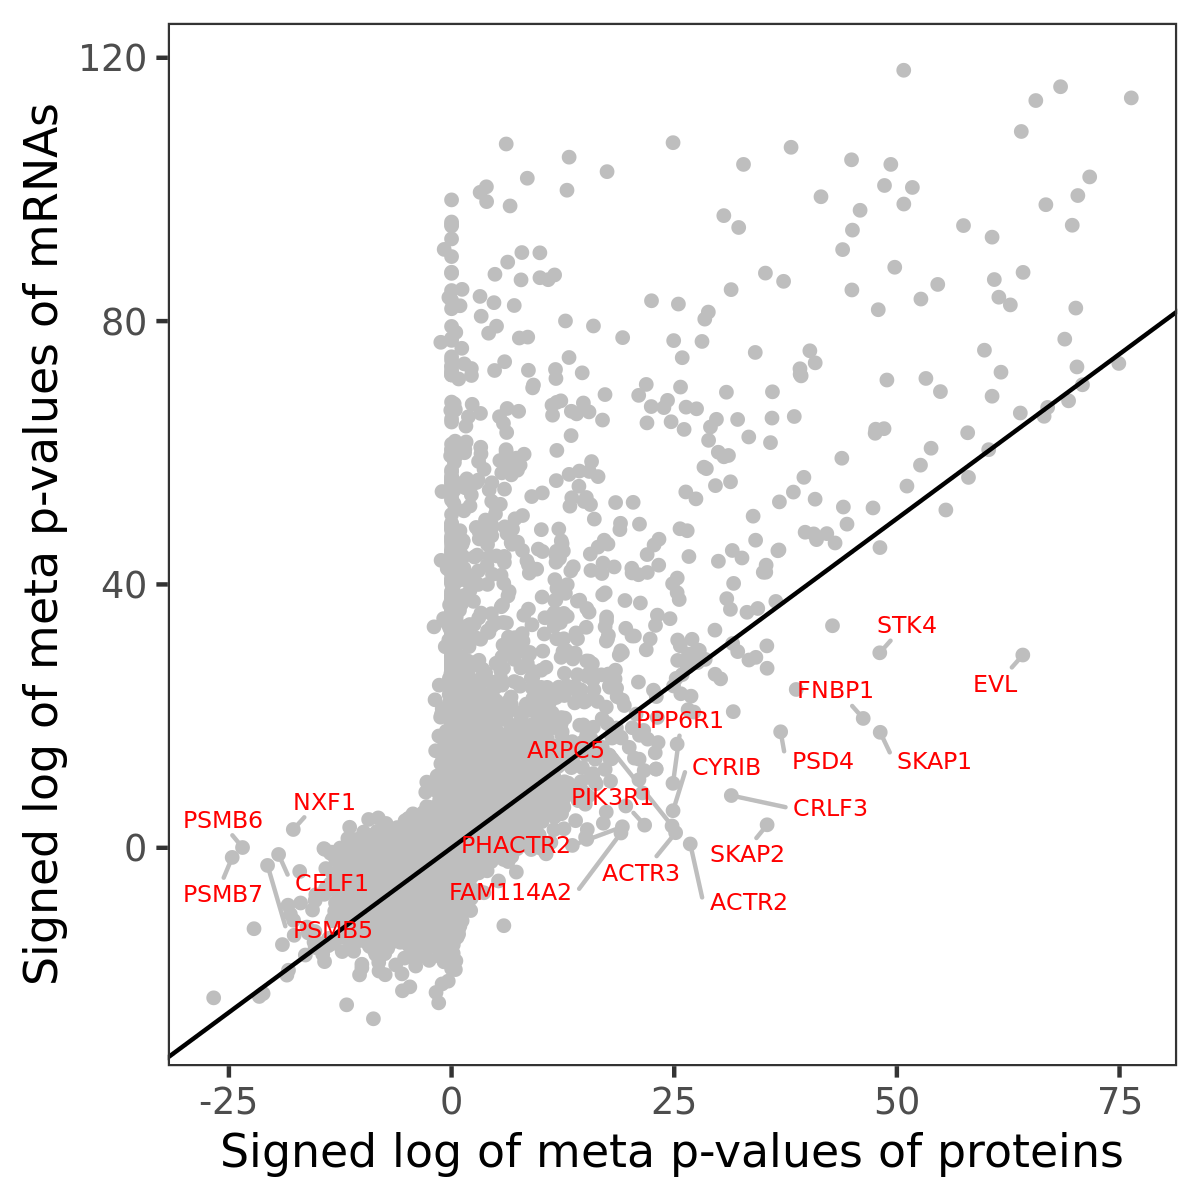
Association of protein abundance of genes
| Signed p-values | |||||||||||
|---|---|---|---|---|---|---|---|---|---|---|---|
| Gene | Meta P | BRCA | CCRCC | COAD | GBM | HNSCC | LSCC | LUAD | OV | PDAC | UCEC |
Gene set enrichment analysis
Submit genes and the common logarithm of the p-values of their association with xcell: T cell CD4+ effector memory to WebGestalt.
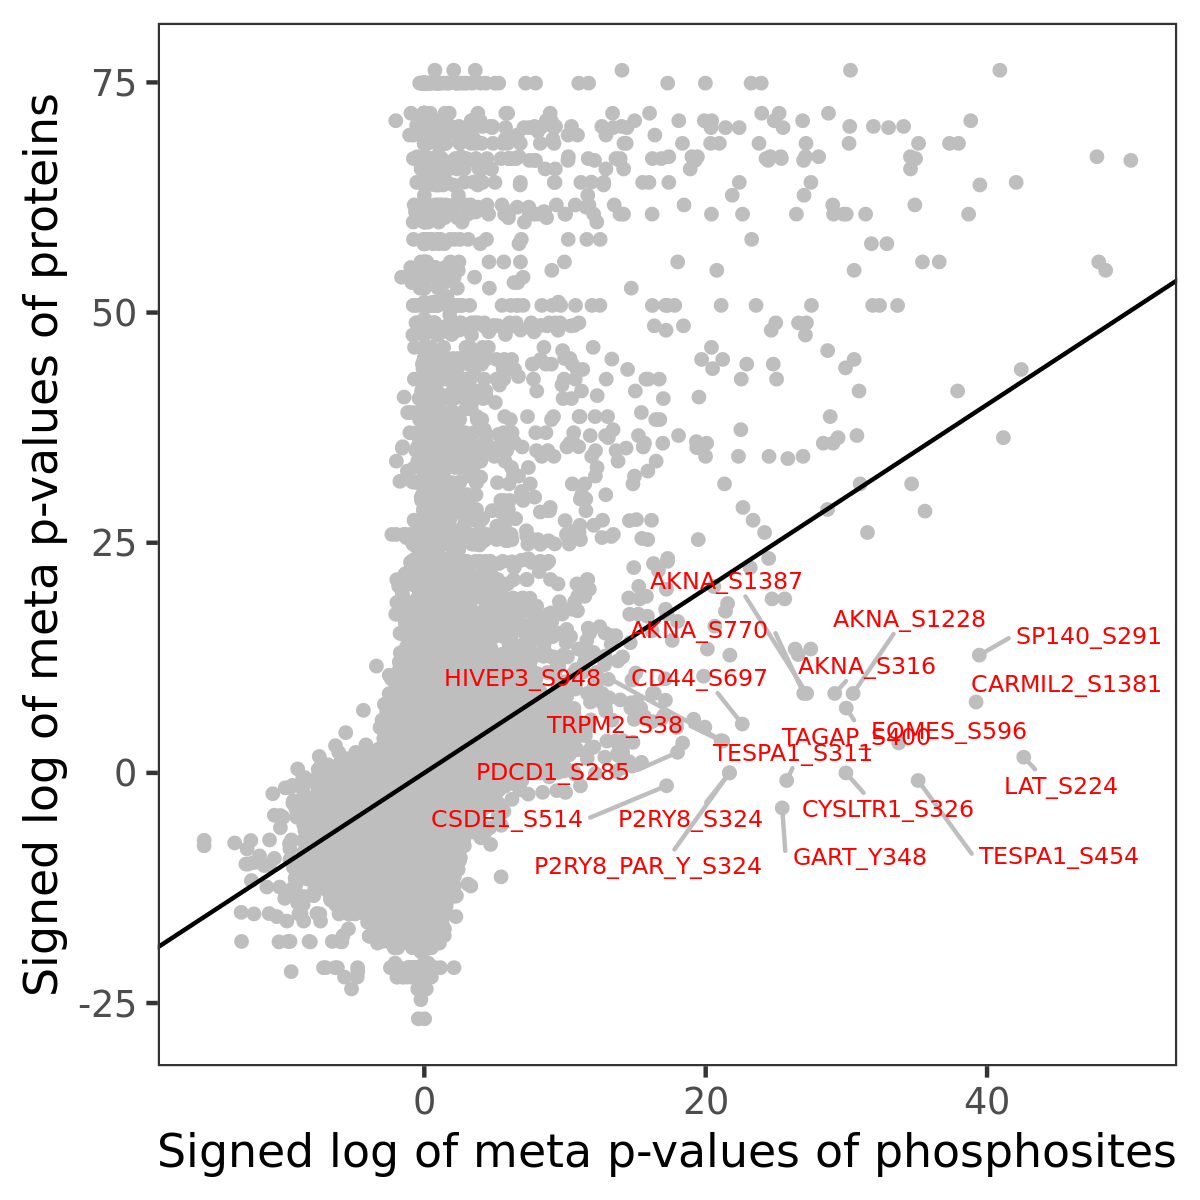
Phosphosite association
Number of significant genes with P-value ≤ 10-6 for each cohorts are summarized in the bar plot. The scatter plot highlights significant associations diven by phosphorylation rather than protein abundance.
| Signed p-values | |||||||||||||
|---|---|---|---|---|---|---|---|---|---|---|---|---|---|
| Gene | Protein | Site | Meta P | BRCA | CCRCC | COAD | GBM | HNSCC | LSCC | LUAD | OV | PDAC | UCEC |
Gene set enrichment analysis
Submit phosphorylation sites and the common logarithm of the p-values of their association with xcell: T cell CD4+ effector memory to WebGestalt.