Basic information
- Phenotype
- xcell: T cell CD4+ naive
- Description
- Enrichment score inferring the proportion of naïve CD4+ T cells in the tumor derived from RNA data using the xCell tool.
- Source
- https://genomebiology.biomedcentral.com/articles/10.1186/s13059-017-1349-1
- Method
- The R package immunedeconv (V2.0.4) (PMID: 31510660) was used to perform immune cell deconvolution using RNA expression data (TPM).
- Genes
-
- ACAP1
- ACBD4
- ANKRD55
- APBB1
- ARFRP1
- ATXN7
- BMS1
- CA5B
- CABIN1
- CASP8
- CCR7
- CD2
- CD226
- CD247
- CD27
- CD28
- CD3E
- CD3G
- CD4
- CD40LG
- CD5
- CD6
- CD7
- CDK1
- CDK10
- CEPT1
- CHMP7
- CLC
- CLUAP1
- COPS7B
- COQ6
- CREBZF
- CRLF3
- CTLA4
- CTSW
- CUBN
- CUL1
- DDX31
- DDX50
- DIDO1
- DNAJB1
- DPEP2
- DSC1
- FAM193B
- FCF1
- FKTN
- FNBP4
- GIMAP6
- GIN1
- GLG1
- GPSM3
- GRAP2
- GRK6
- GZMM
- HAUS3
- HMOX2
- ICOS
- IDUA
- IL16
- INPP4A
- INSL3
- IPCEF1
- ITK
- JAK3
- KDM3A
- KLHL3
- KRI1
- KRT2
- LAIR2
- LEPROTL1
- LIMD2
- LY9
- MAK
- MLH3
- MLXIP
- MSL3
- MTRF1
- NAA16
- NCK2
- NDFIP1
- NOL9
- NPAT
- NUDCD3
- NUDT9
- NUMA1
- NUP50
- OBSCN
- PACS1
- PARP11
- PHF1
- PHF20L1
- PIP4K2B
- PLCG1
- PLCL1
- PLXDC1
- POLR3E
- POP5
- PRMT2
- PRMT3
- RAB3GAP1
- RAPGEF6
- RBL2
- RBMS1
- REV1
- RNF216
- RNPEPL1
- RPA3
- RPAP2
- RPL14
- RPL38
- RPLP2
- RPRD2
- RPS6
- RXRB
- SELPLG
- SETD5
- SH2B1
- SIRPG
- SIT1
- SLTM
- SNPH
- SORCS3
- STAP1
- SUPV3L1
- TATDN2
- TBC1D5
- TEX264
- TMEM30B
- TNFSF8
- TNK1
- TPP2
- TRAF1
- TRAF3IP3
- TRAT1
- TSPAN32
- TUG1
- UBASH3A
- USP16
- UTP20
- VPS52
- WDR6
- WDR82
- ZAP70
- ZBTB40
- ZNF263
- ZNF264
- ZNF394
- ZNF609
- ZNF76
- ZNF780B
- More...
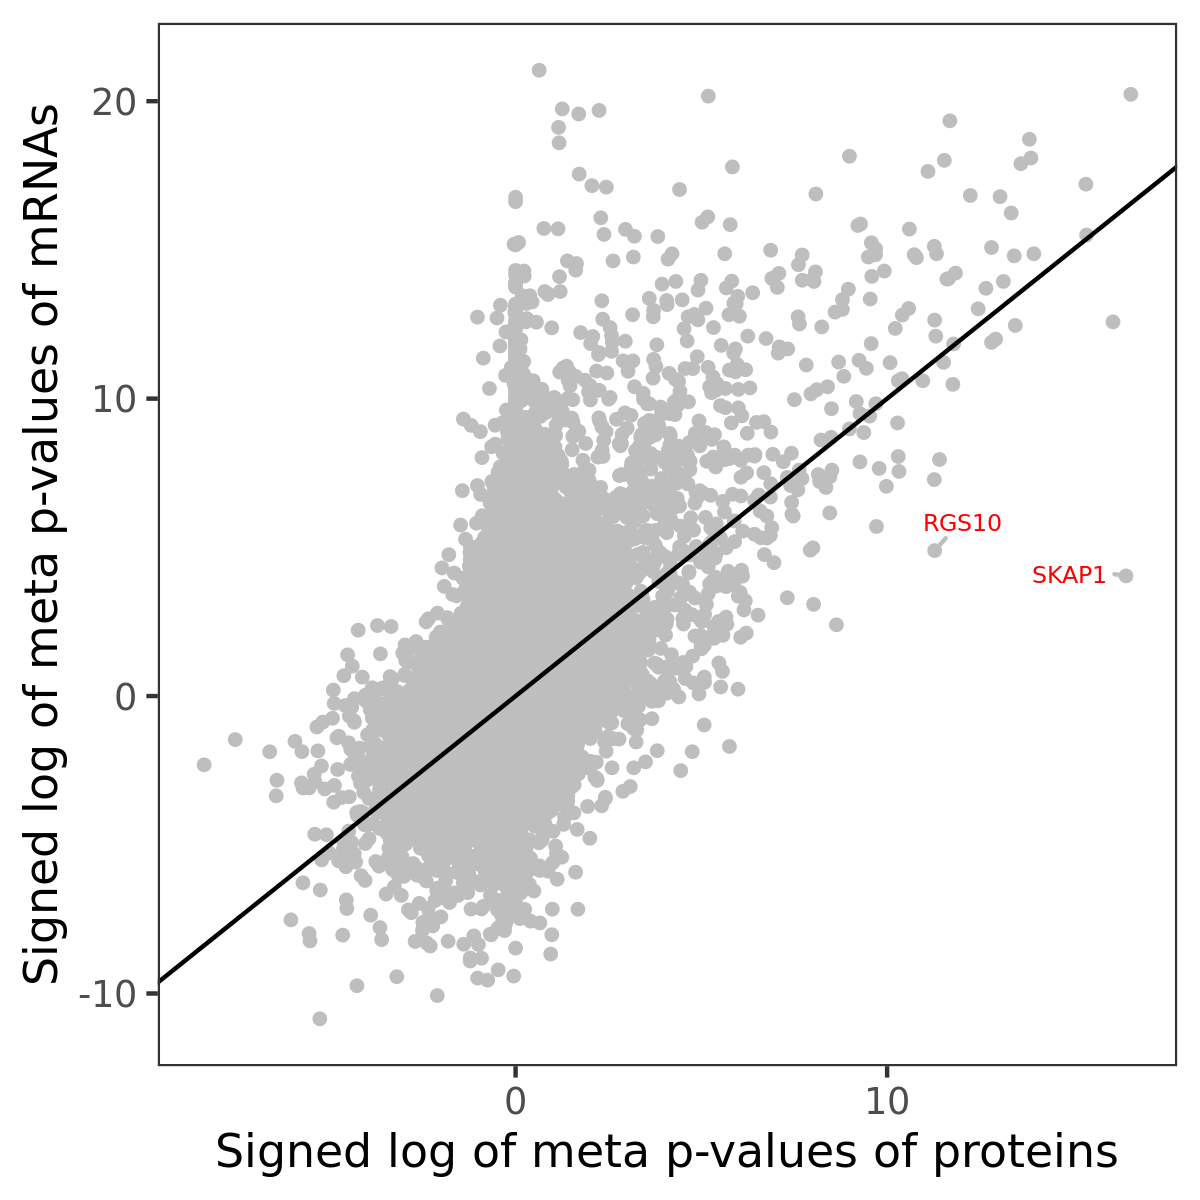
Gene association
Number of significant genes with P-value ≤ 10-6 for each cohorts are summarized in bar plots. The scatter plot highlights significant associations diven by protein rather than mRNA abundance.
Association of protein abundance of genes
Signed p-values | ||||||||||||
|---|---|---|---|---|---|---|---|---|---|---|---|---|
Gene | Meta P | BRCA | CCRCC | COAD | GBM | HNSCC | LSCC | LUAD | OV | PDAC | UCEC | |
| No matching records found | ||||||||||||
Gene set enrichment analysis
Submit genes and the common logarithm of the p-values of their association with xcell: T cell CD4+ naive to WebGestalt.
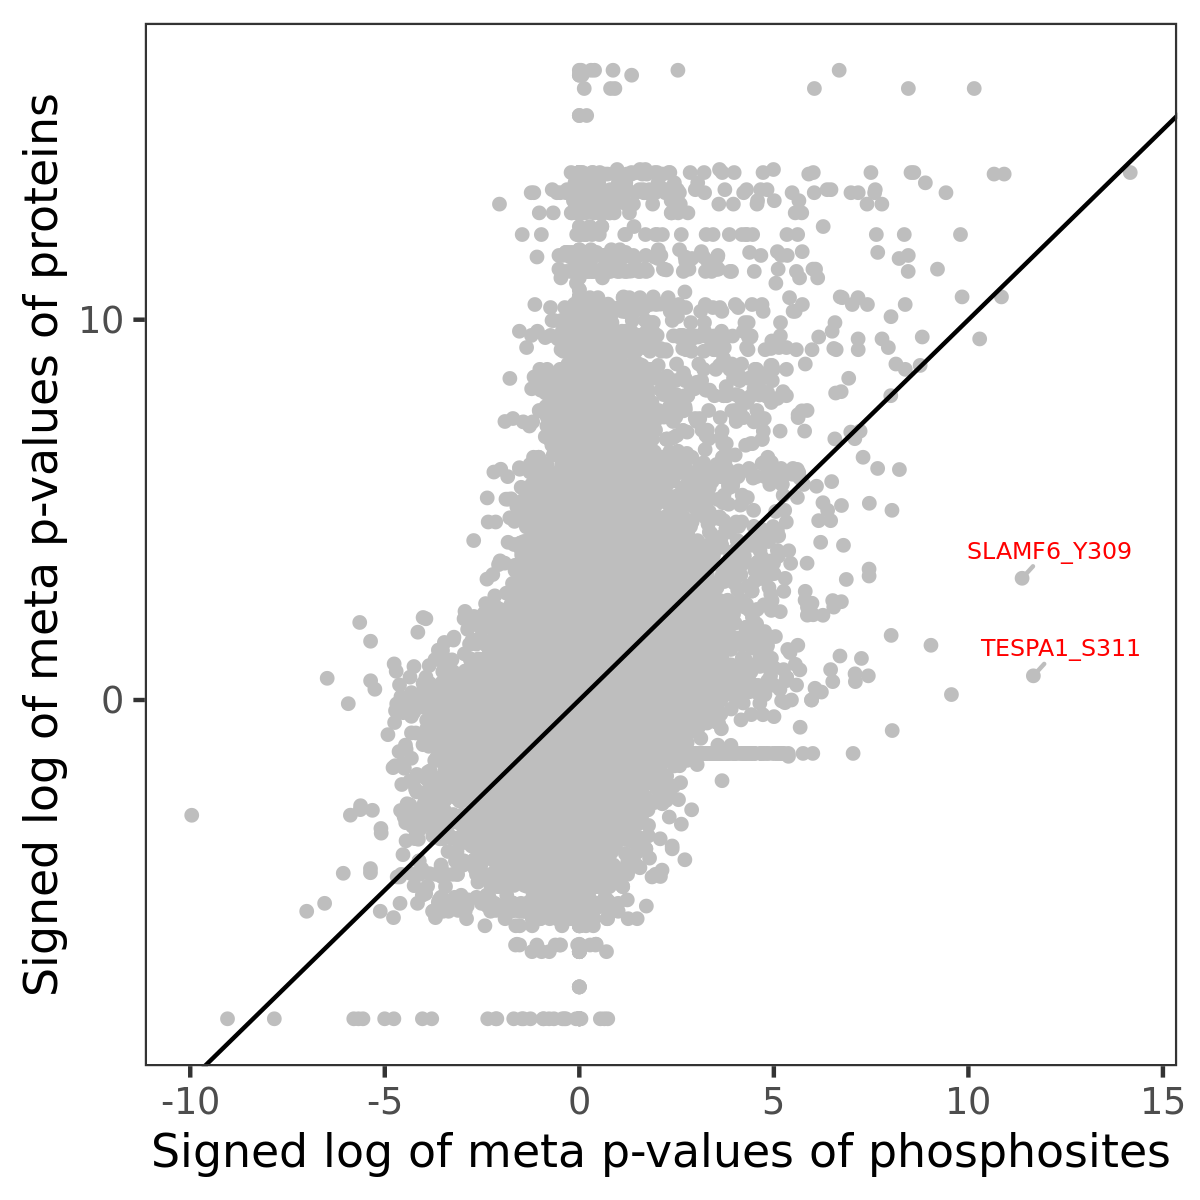
Phosphosite association
Number of significant genes with P-value ≤ 10-6 for each cohorts are summarized in the bar plot. The scatter plot highlights significant associations diven by phosphorylation rather than protein abundance.
Signed p-values | |||||||||||||
|---|---|---|---|---|---|---|---|---|---|---|---|---|---|
Gene | Protein | Site | Meta P | BRCA | CCRCC | COAD | GBM | HNSCC | LSCC | LUAD | OV | PDAC | UCEC |
| No matching records found | |||||||||||||
Gene set enrichment analysis
Submit phosphorylation sites and the common logarithm of the p-values of their association with xcell: T cell CD4+ naive to WebGestalt.