Basic information
- Phenotype
- HALLMARK_ADIPOGENESIS
- Description
- Enrichment score representing genes involved in adipogenesis. The score was calculated using ssGSEA on the RNA data (Z-score transformed coding genes with expression in at least 50% of the samples in a cohort).
- Source
- http://www.gsea-msigdb.org/gsea/msigdb/cards/HALLMARK_ADIPOGENESIS.html
- Method
- Single sample gene set enrichment analysis (ssGSEA) was performed for each cancer type using gene-wise Z-scores of the RNA expression data (RSEM) for the MSigDB Hallmark gene sets v7.0 (PMID: 26771021) via the ssGSEA2.0 R package (PMID: 30563849). RNA data were filtered to coding genes with < 50% 0 expression. (Parameters: sample.norm.type="rank", weight=0.75, statistic="area.under.RES", nperm=1000, min.overlap=10). Pathway activity scores are normalized enrichment scores from ssGSEA.
- Genes
-
- ABCB8
- ACAA2
- ACADL
- ACADM
- ACADS
- ACLY
- ACO2
- ACOX1
- ADCY6
- ADIG
- ADIPOQ
- ADIPOR2
- AGPAT3
- AIFM1
- AK2
- ALDH2
- ALDOA
- ANGPT1
- ANGPTL4
- APLP2
- APOE
- ARAF
- ARL4A
- ATL2
- ATP1B3
- ATP5PO
- BAZ2A
- BCKDHA
- BCL2L13
- BCL6
- C3
- CAT
- CAVIN1
- CAVIN2
- CCNG2
- CD151
- CD302
- CD36
- CDKN2C
- CHCHD10
- CHUK
- CIDEA
- CMBL
- CMPK1
- COL15A1
- COL4A1
- COQ3
- COQ5
- COQ9
- COX6A1
- COX7B
- COX8A
- CPT2
- CRAT
- CS
- CYC1
- CYP4B1
- DBT
- DDT
- DECR1
- DGAT1
- DHCR7
- DHRS7
- DHRS7B
- DLAT
- DLD
- DNAJB9
- DNAJC15
- DRAM2
- ECH1
- ECHS1
- ELMOD3
- ELOVL6
- ENPP2
- EPHX2
- ESRRA
- ESYT1
- ETFB
- FABP4
- FAH
- FZD4
- G3BP2
- GADD45A
- GBE1
- GHITM
- GPAM
- GPAT4
- GPD2
- GPHN
- GPX3
- GPX4
- GRPEL1
- HADH
- HIBCH
- HSPB8
- IDH1
- IDH3A
- IDH3G
- IFNGR1
- IMMT
- ITGA7
- ITIH5
- ITSN1
- JAGN1
- LAMA4
- LEP
- LIFR
- LIPE
- LPCAT3
- LPL
- LTC4S
- MAP4K3
- MCCC1
- MDH2
- ME1
- MGLL
- MGST3
- MIGA2
- MRAP
- MRPL15
- MTARC2
- MTCH2
- MYLK
- NABP1
- NDUFA5
- NDUFAB1
- NDUFB7
- NDUFS3
- NKIRAS1
- NMT1
- OMD
- ORM1
- PDCD4
- PEMT
- PEX14
- PFKFB3
- PFKL
- PGM1
- PHLDB1
- PHYH
- PIM3
- PLIN2
- POR
- PPARG
- PPM1B
- PPP1R15B
- PRDX3
- PREB
- PTCD3
- PTGER3
- QDPR
- RAB34
- REEP5
- REEP6
- RETN
- RETSAT
- RIOK3
- RMDN3
- RNF11
- RREB1
- RTN3
- SAMM50
- SCARB1
- SCP2
- SDHB
- SDHC
- SLC19A1
- SLC1A5
- SLC25A1
- SLC25A10
- SLC27A1
- SLC5A6
- SLC66A3
- SNCG
- SOD1
- SORBS1
- SOWAHC
- SPARCL1
- SQOR
- SSPN
- STAT5A
- STOM
- SUCLG1
- SULT1A1
- TALDO1
- TANK
- TKT
- TOB1
- TST
- UBC
- UBQLN1
- UCK1
- UCP2
- UQCR10
- UQCR11
- UQCRC1
- UQCRQ
- VEGFB
- YWHAG
- More...
Gene association
Number of significant genes with P-value ≤ 10-6 for each cohorts are summarized in bar plots. The scatter plot highlights significant associations diven by protein rather than mRNA abundance.
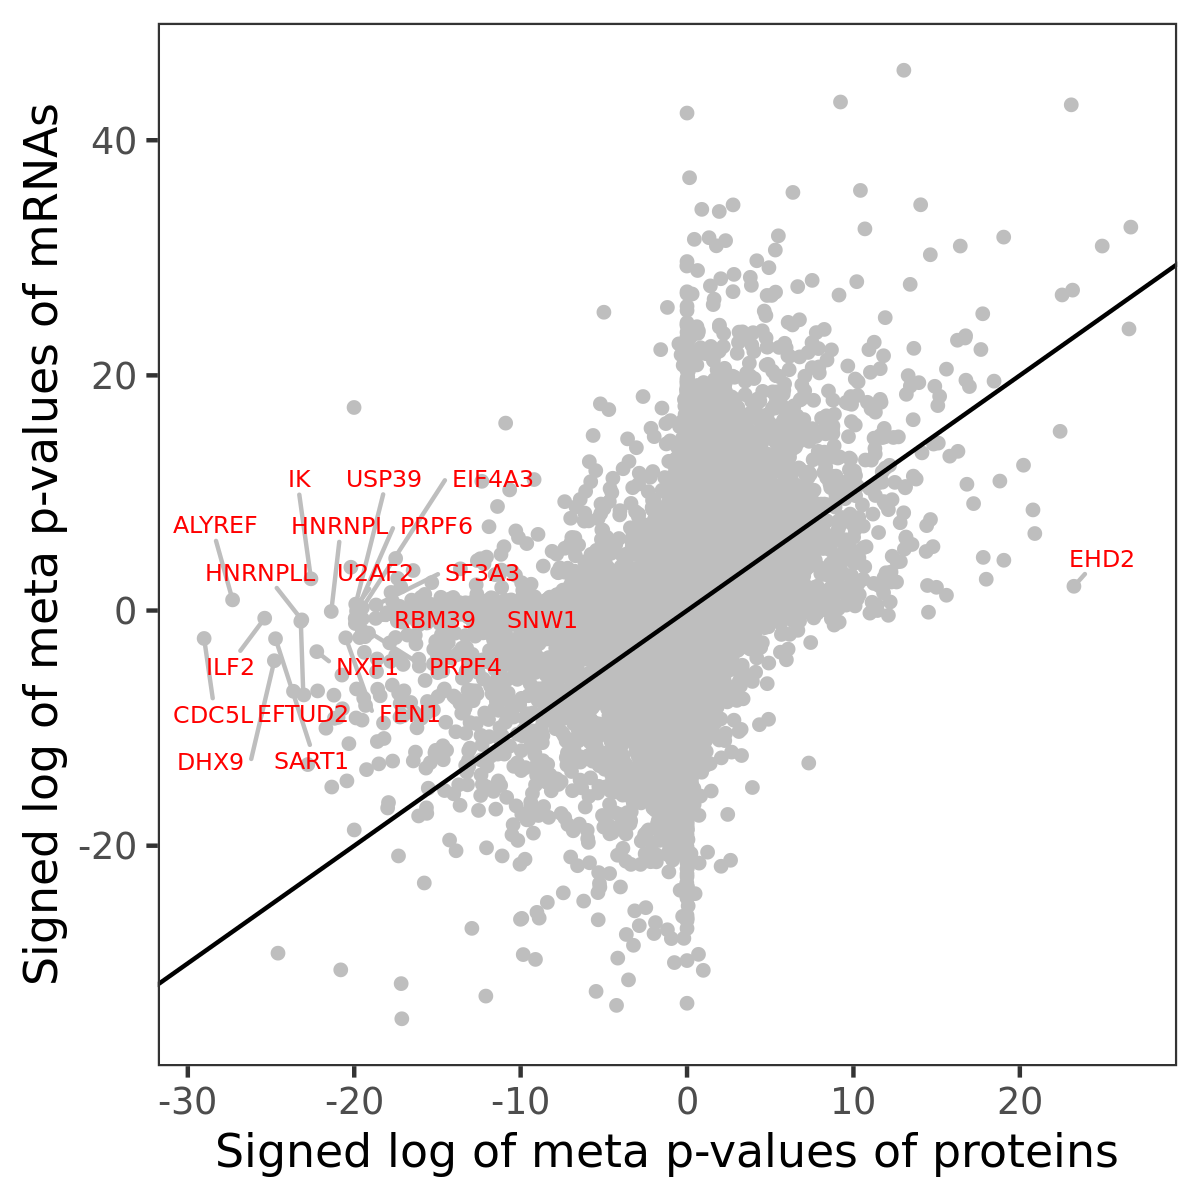
Association of protein abundance of genes
| Signed p-values | |||||||||||
|---|---|---|---|---|---|---|---|---|---|---|---|
| Gene | Meta P | BRCA | CCRCC | COAD | GBM | HNSCC | LSCC | LUAD | OV | PDAC | UCEC |
Gene set enrichment analysis
Submit genes and the common logarithm of the p-values of their association with HALLMARK_ADIPOGENESIS to WebGestalt.
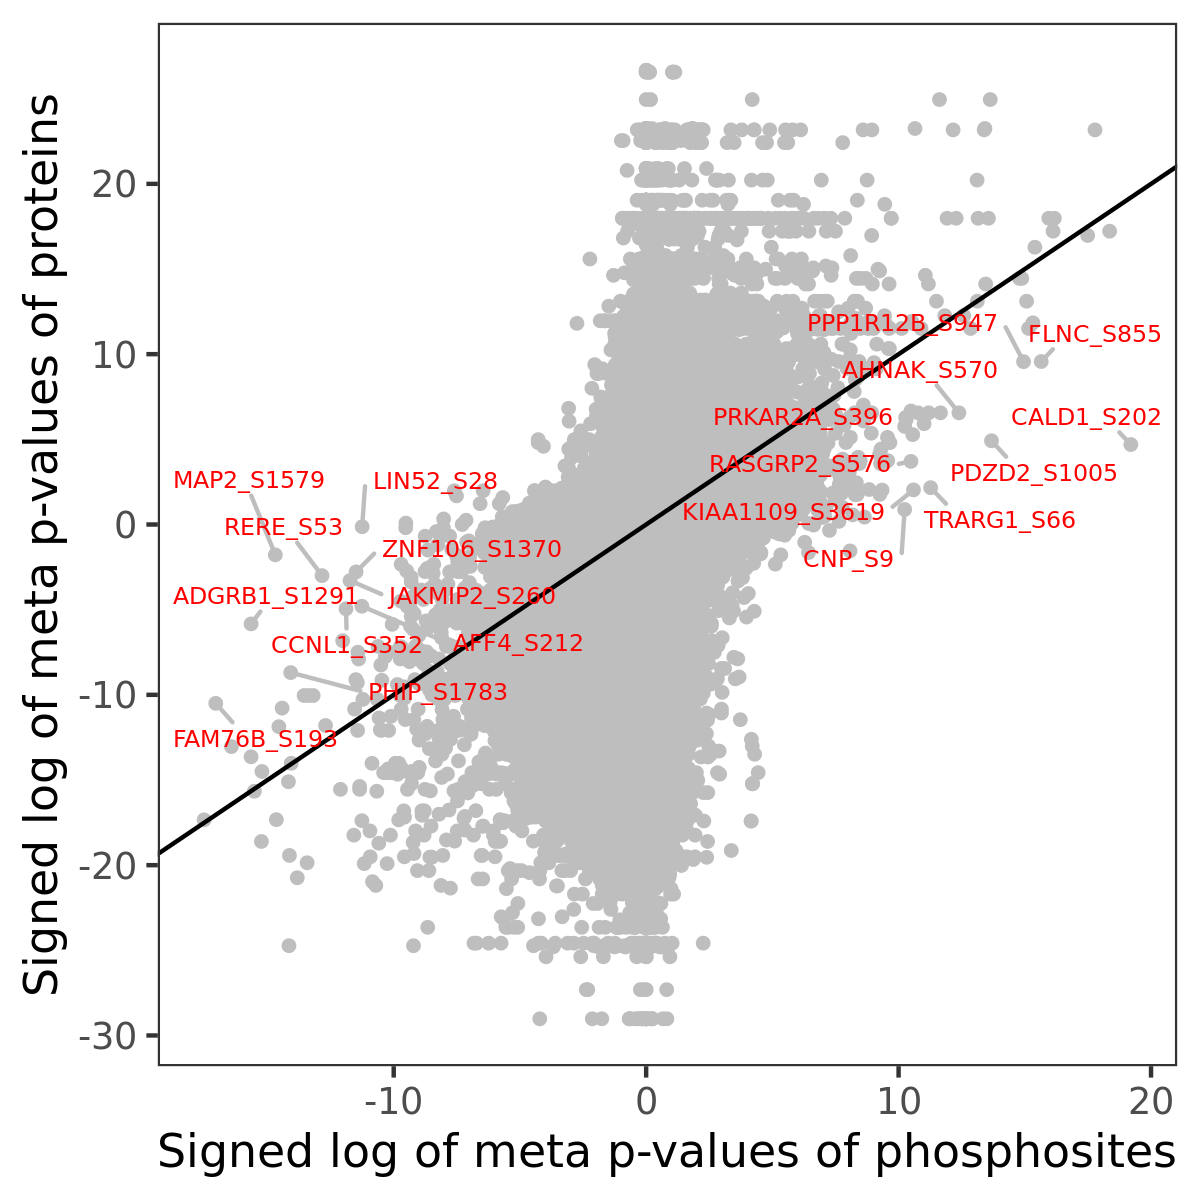
Phosphosite association
Number of significant genes with P-value ≤ 10-6 for each cohorts are summarized in the bar plot. The scatter plot highlights significant associations diven by phosphorylation rather than protein abundance.
| Signed p-values | |||||||||||||
|---|---|---|---|---|---|---|---|---|---|---|---|---|---|
| Gene | Protein | Site | Meta P | BRCA | CCRCC | COAD | GBM | HNSCC | LSCC | LUAD | OV | PDAC | UCEC |
Gene set enrichment analysis
Submit phosphorylation sites and the common logarithm of the p-values of their association with HALLMARK_ADIPOGENESIS to WebGestalt.