Basic information
- Phenotype
- HALLMARK_APOPTOSIS
- Description
- Enrichment score representing genes involved in apoptosis. The score was calculated using ssGSEA on the RNA data (Z-score transformed coding genes with expression in at least 50% of the samples in a cohort).
- Source
- http://www.gsea-msigdb.org/gsea/msigdb/cards/HALLMARK_APOPTOSIS.html
- Method
- Single sample gene set enrichment analysis (ssGSEA) was performed for each cancer type using gene-wise Z-scores of the RNA expression data (RSEM) for the MSigDB Hallmark gene sets v7.0 (PMID: 26771021) via the ssGSEA2.0 R package (PMID: 30563849). RNA data were filtered to coding genes with < 50% 0 expression. (Parameters: sample.norm.type="rank", weight=0.75, statistic="area.under.RES", nperm=1000, min.overlap=10). Pathway activity scores are normalized enrichment scores from ssGSEA.
- Genes
-
- AIFM3
- ANKH
- ANXA1
- APP
- ATF3
- AVPR1A
- BAX
- BCAP31
- BCL10
- BCL2L1
- BCL2L10
- BCL2L11
- BCL2L2
- BGN
- BID
- BIK
- BIRC3
- BMF
- BMP2
- BNIP3L
- BRCA1
- BTG2
- BTG3
- CASP1
- CASP2
- CASP3
- CASP4
- CASP6
- CASP7
- CASP8
- CASP9
- CAV1
- CCNA1
- CCND1
- CCND2
- CD14
- CD2
- CD38
- CD44
- CD69
- CDC25B
- CDK2
- CDKN1A
- CDKN1B
- CFLAR
- CLU
- CREBBP
- CTH
- CTNNB1
- CYLD
- DAP
- DAP3
- DCN
- DDIT3
- DFFA
- DIABLO
- DNAJA1
- DNAJC3
- DNM1L
- DPYD
- EBP
- EGR3
- EMP1
- ENO2
- ERBB2
- ERBB3
- EREG
- ETF1
- F2
- F2R
- FAS
- FASLG
- FDXR
- FEZ1
- GADD45A
- GADD45B
- GCH1
- GNA15
- GPX1
- GPX3
- GPX4
- GSN
- GSR
- GSTM1
- GUCY2D
- H1-0
- HGF
- HMGB2
- HMOX1
- HSPB1
- IER3
- IFITM3
- IFNB1
- IFNGR1
- IGF2R
- IGFBP6
- IL18
- IL1A
- IL1B
- IL6
- IRF1
- ISG20
- JUN
- KRT18
- LEF1
- LGALS3
- LMNA
- LUM
- MADD
- MCL1
- MGMT
- MMP2
- NEDD9
- NEFH
- PAK1
- PDCD4
- PDGFRB
- PEA15
- PLAT
- PLCB2
- PLPPR4
- PMAIP1
- PPP2R5B
- PPP3R1
- PPT1
- PRF1
- PSEN1
- PSEN2
- PTK2
- RARA
- RELA
- RETSAT
- RHOB
- RHOT2
- RNASEL
- ROCK1
- SAT1
- SATB1
- SC5D
- SLC20A1
- SMAD7
- SOD1
- SOD2_ENSG00000285441
- SPTAN1
- SQSTM1
- TAP1
- TGFB2
- TGFBR3
- TIMP1
- TIMP2
- TIMP3
- TNF
- TNFRSF12A
- TNFSF10
- TOP2A
- TSPO
- TXNIP
- VDAC2
- WEE1
- XIAP
- More...
Gene association
Number of significant genes with P-value ≤ 10-6 for each cohorts are summarized in bar plots. The scatter plot highlights significant associations diven by protein rather than mRNA abundance.
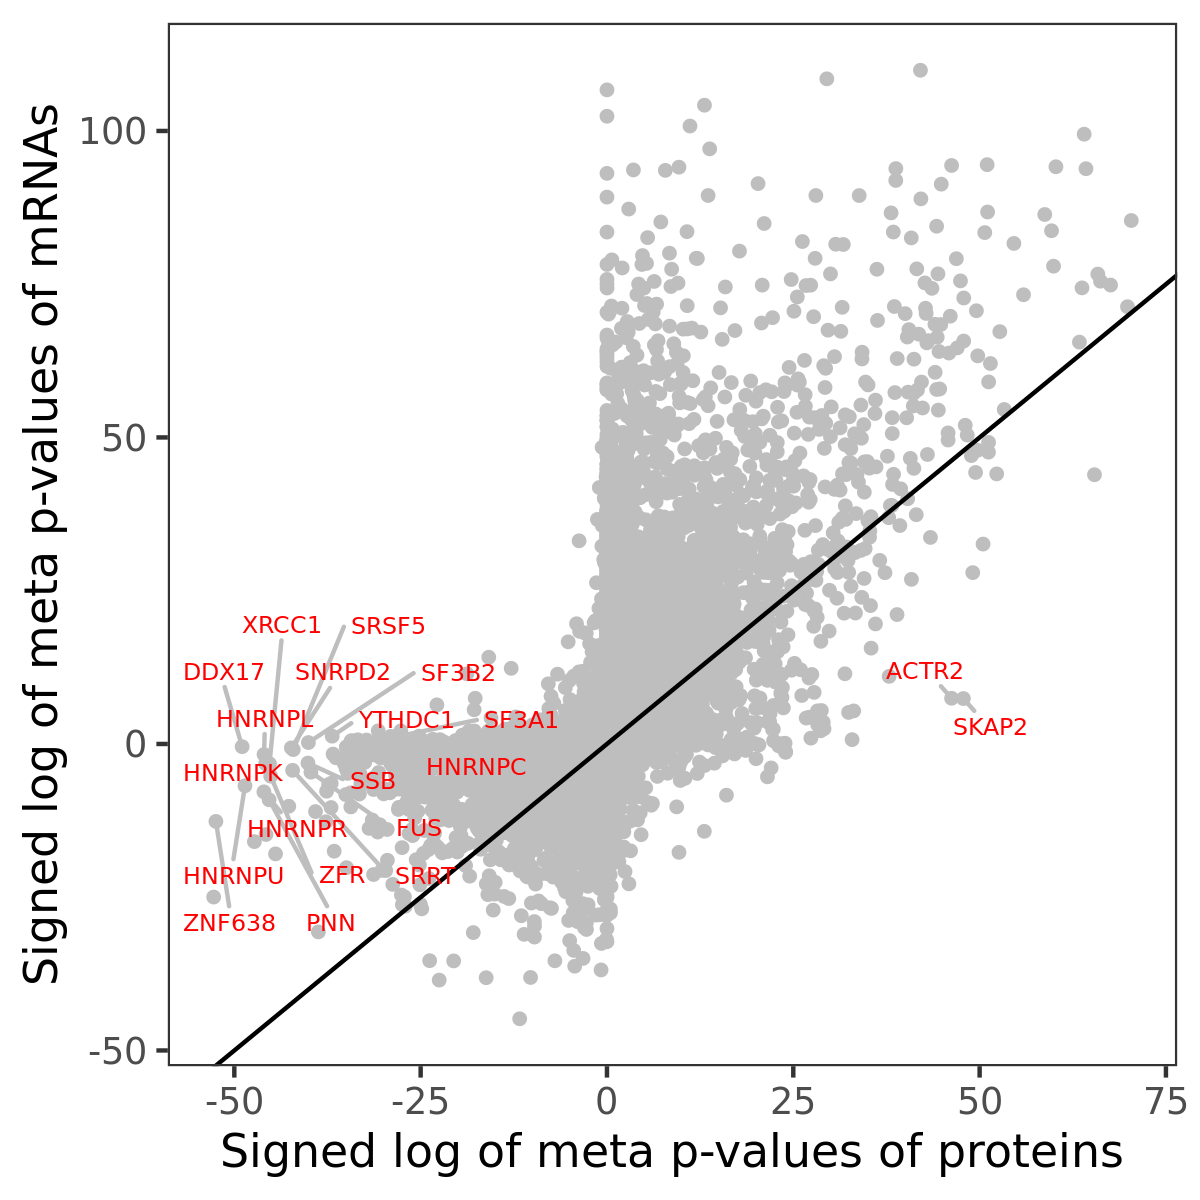
Association of protein abundance of genes
| Signed p-values | |||||||||||
|---|---|---|---|---|---|---|---|---|---|---|---|
| Gene | Meta P | BRCA | CCRCC | COAD | GBM | HNSCC | LSCC | LUAD | OV | PDAC | UCEC |
Gene set enrichment analysis
Submit genes and the common logarithm of the p-values of their association with HALLMARK_APOPTOSIS to WebGestalt.
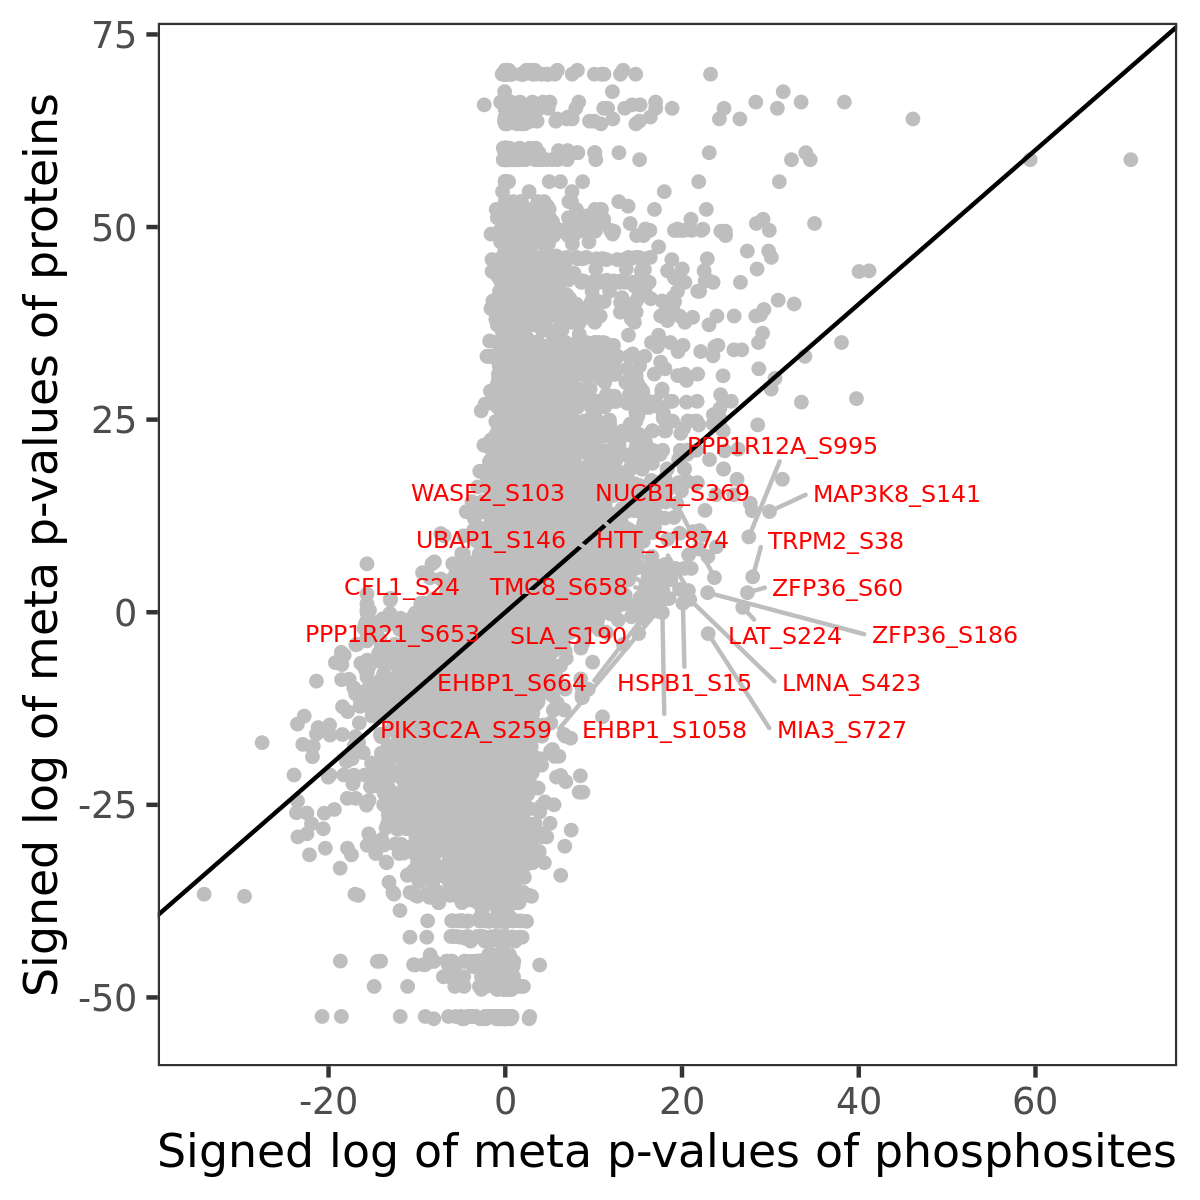
Phosphosite association
Number of significant genes with P-value ≤ 10-6 for each cohorts are summarized in the bar plot. The scatter plot highlights significant associations diven by phosphorylation rather than protein abundance.
| Signed p-values | |||||||||||||
|---|---|---|---|---|---|---|---|---|---|---|---|---|---|
| Gene | Protein | Site | Meta P | BRCA | CCRCC | COAD | GBM | HNSCC | LSCC | LUAD | OV | PDAC | UCEC |
Gene set enrichment analysis
Submit phosphorylation sites and the common logarithm of the p-values of their association with HALLMARK_APOPTOSIS to WebGestalt.