Basic information
- Phenotype
- HALLMARK_IL6_JAK_STAT3_SIGNALING
- Description
- Enrichment score representing IL6/JAK/STAT3 signaling. The score was calculated using ssGSEA on the RNA data (Z-score transformed coding genes with expression in at least 50% of the samples in a cohort).
- Source
- http://www.gsea-msigdb.org/gsea/msigdb/cards/HALLMARK_IL6_JAK_STAT3_SIGNALING.html
- Method
- Single sample gene set enrichment analysis (ssGSEA) was performed for each cancer type using gene-wise Z-scores of the RNA expression data (RSEM) for the MSigDB Hallmark gene sets v7.0 (PMID: 26771021) via the ssGSEA2.0 R package (PMID: 30563849). RNA data were filtered to coding genes with < 50% 0 expression. (Parameters: sample.norm.type="rank", weight=0.75, statistic="area.under.RES", nperm=1000, min.overlap=10). Pathway activity scores are normalized enrichment scores from ssGSEA.
- Genes
-
- A2M
- ACVR1B
- ACVRL1
- BAK1
- CBL
- CCL7
- CCR1
- CD14
- CD36
- CD38
- CD44
- CD9
- CNTFR
- CRLF2_PAR_Y
- CSF1
- CSF2
- CSF2RA_PAR_Y
- CSF2RB
- CSF3R
- CXCL1
- CXCL10
- CXCL11
- CXCL13
- CXCL3
- CXCL9
- DNTT
- EBI3
- FAS
- GRB2
- HAX1
- HMOX1
- IFNAR1
- IFNGR1
- IFNGR2
- IL10RB
- IL12RB1
- IL13RA1
- IL15RA
- IL17RA
- IL17RB
- IL18R1
- IL1B
- IL1R1
- IL1R2
- IL2RA
- IL2RG
- IL3RA_PAR_Y
- IL4R
- IL6
- IL6ST
- IL7
- IL9R_PAR_Y
- INHBE
- IRF1
- IRF9
- ITGA4
- ITGB3
- JUN
- LEPR
- LTB
- MAP3K8
- MYD88
- OSMR
- PDGFC
- PF4
- PIK3R5
- PIM1
- PLA2G2A
- PTPN1
- PTPN11
- PTPN2
- REG1A
- SOCS1
- SOCS3
- STAM2
- STAT1
- STAT2
- STAT3
- TGFB1
- TLR2
- TNF
- TNFRSF12A
- TNFRSF1A
- TNFRSF1B
- TNFRSF21
- TYK2
- More...
Gene association
Number of significant genes with P-value ≤ 10-6 for each cohorts are summarized in bar plots. The scatter plot highlights significant associations diven by protein rather than mRNA abundance.
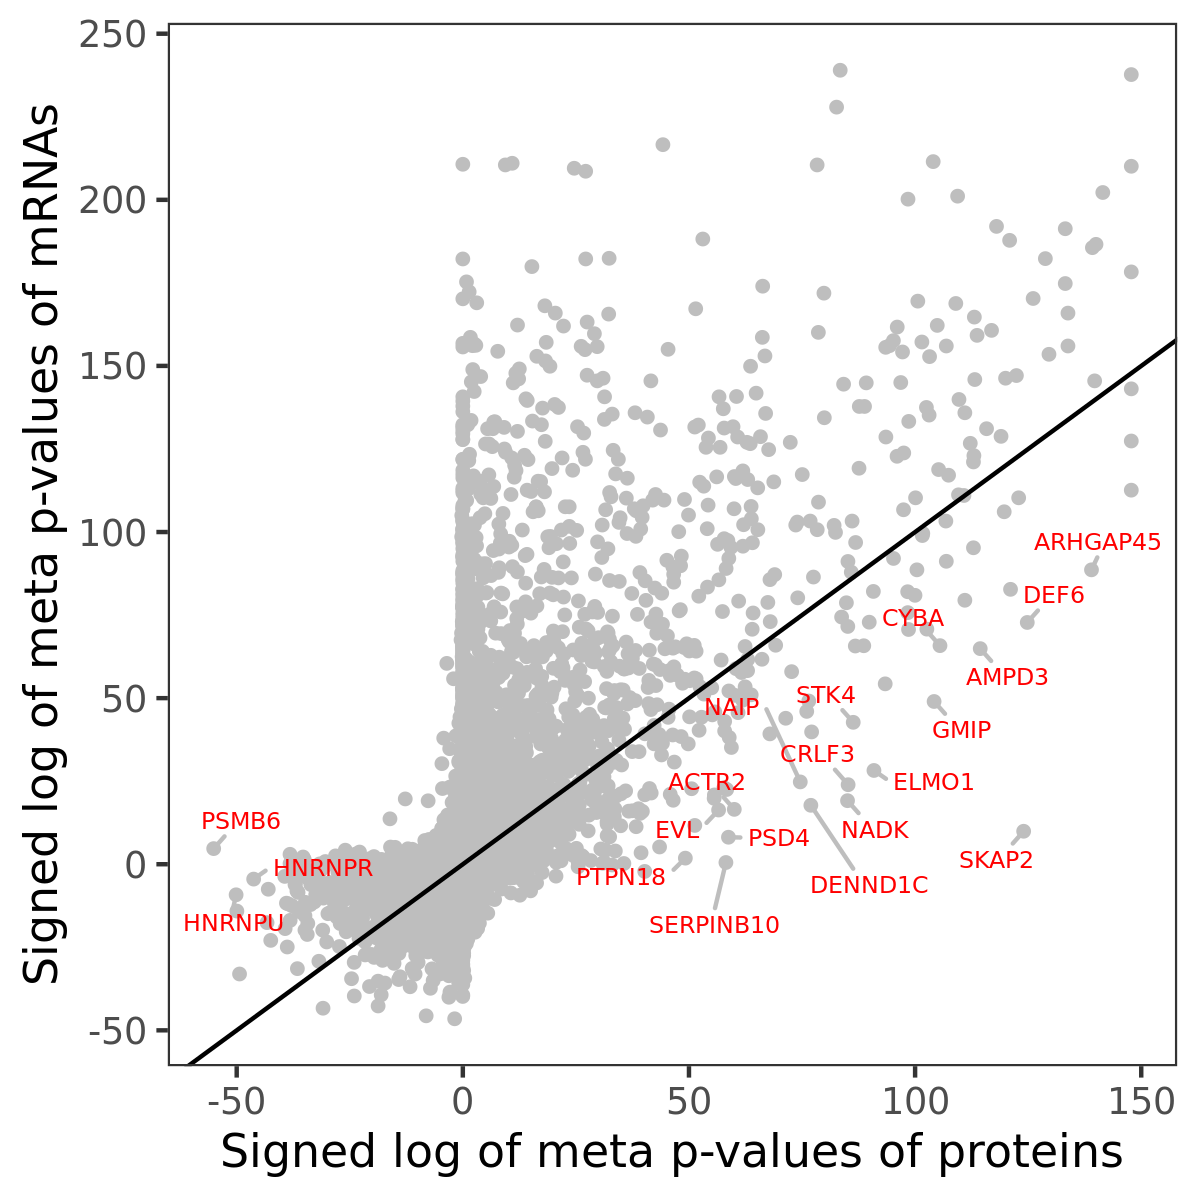
Association of protein abundance of genes
| Signed p-values | |||||||||||
|---|---|---|---|---|---|---|---|---|---|---|---|
| Gene | Meta P | BRCA | CCRCC | COAD | GBM | HNSCC | LSCC | LUAD | OV | PDAC | UCEC |
Gene set enrichment analysis
Submit genes and the common logarithm of the p-values of their association with HALLMARK_IL6_JAK_STAT3_SIGNALING to WebGestalt.
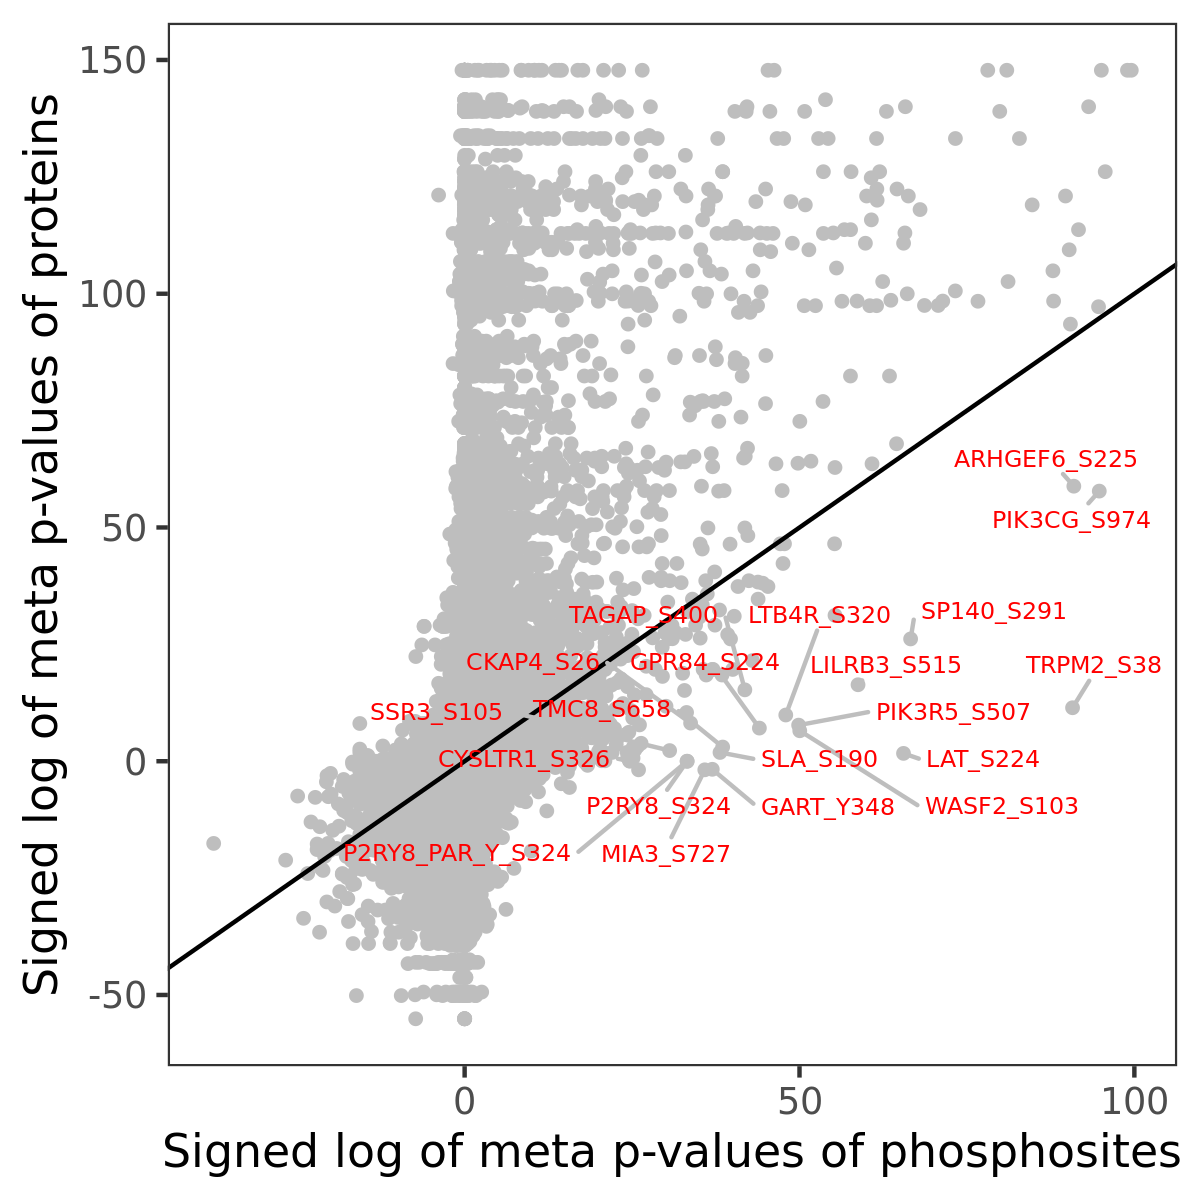
Phosphosite association
Number of significant genes with P-value ≤ 10-6 for each cohorts are summarized in the bar plot. The scatter plot highlights significant associations diven by phosphorylation rather than protein abundance.
| Signed p-values | |||||||||||||
|---|---|---|---|---|---|---|---|---|---|---|---|---|---|
| Gene | Protein | Site | Meta P | BRCA | CCRCC | COAD | GBM | HNSCC | LSCC | LUAD | OV | PDAC | UCEC |
Gene set enrichment analysis
Submit phosphorylation sites and the common logarithm of the p-values of their association with HALLMARK_IL6_JAK_STAT3_SIGNALING to WebGestalt.