Basic information
- Phenotype
- cibersort: Mast cell activated
- Description
- Estimated fraction of activated mast cells in the tumor compared to 21 other immune cells defined by CIBERSORT based on RNA expression data.
- Source
- https://www.nature.com/articles/nmeth.3337
- Method
- The R package immunedeconv (V2.0.4) (PMID: 31510660) was used to perform immune cell deconvolution using RNA expression data (TPM). CIBERSORT (PMID: 25822800) was performed in the ‘abs’ mode.
- Genes
-
- ADAMDEC1
- ADAMTS3
- ADRB2
- AIF1
- ALOX5
- APOBEC3G
- AQP9
- ATP8B4
- AZU1
- BCL2A1
- BMP2K
- BPI
- BST1
- C3AR1
- C5AR1
- CCL18
- CCL23
- CCL4
- CD300A
- CD33
- CD37
- CD38
- CD69
- CEACAM8
- CHI3L1
- CHST15
- CLC
- CLEC7A
- CMA1
- CPA3
- CST7
- CTSG
- CYP27A1
- EAF2
- ELANE
- FAM124B
- FAM174B
- FCER1A
- FCGR2B
- FCN1
- FPR1
- GFI1
- GPR65
- GZMB
- HCK
- HDC
- HHEX
- HOXA1
- HPGDS
- IL18R1
- IL1B
- IL1RL1
- IL4R
- IRF8
- ITK
- KLRG1
- LAT
- LRMP
- LST1
- LTC4S
- MAN1A1
- MAP4K1
- MMP9
- MNDA
- MS4A2
- MS4A3
- MS4A6A
- MYB
- NCF2
- NKG7
- NPL
- NTRK1
- P2RX1
- P2RY14
- PAQR5
- PIK3IP1
- PLA2G7
- PRF1
- PRG2
- PTGER2
- RAB27B
- RGS1
- RGS13
- RNASE2
- RNASE6
- RSAD2
- S100A12
- SAMSN1
- SELL
- SKAP1
- SLC12A8
- SLC2A6
- ST3GAL6
- STAP1
- TLR2
- TPSAB1
- TREM2
- TRIB2
- TTC38
- More...
Gene association
Number of significant genes with P-value ≤ 10-6 for each cohorts are summarized in bar plots. The scatter plot highlights significant associations diven by protein rather than mRNA abundance.
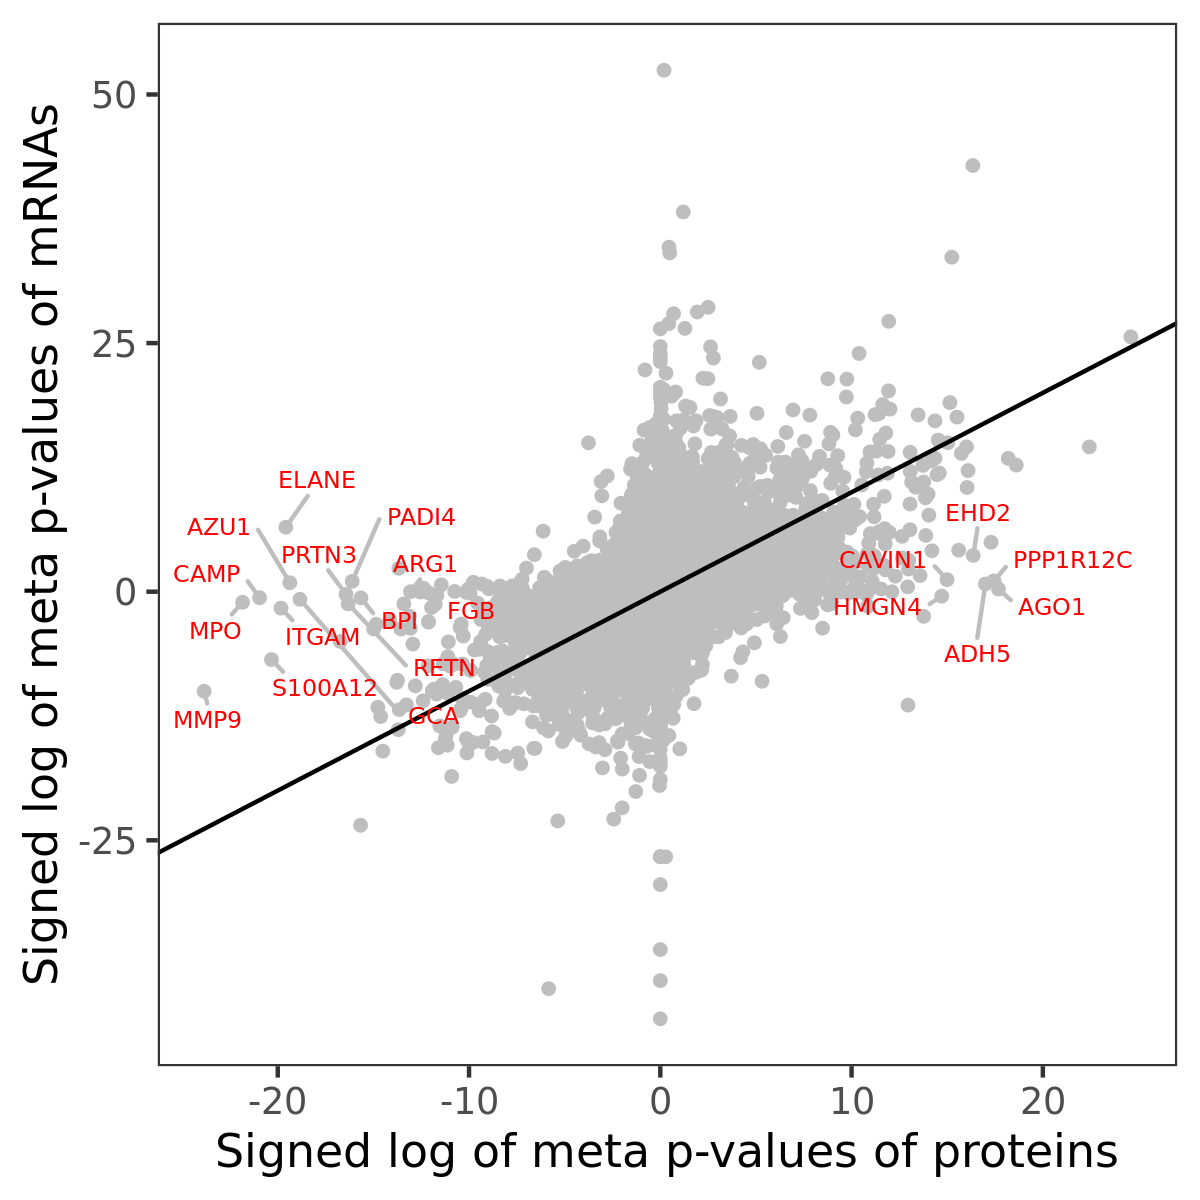
Association of protein abundance of genes
| Signed p-values | |||||||||||
|---|---|---|---|---|---|---|---|---|---|---|---|
| Gene | Meta P | BRCA | CCRCC | COAD | GBM | HNSCC | LSCC | LUAD | OV | PDAC | UCEC |
Gene set enrichment analysis
Submit genes and the common logarithm of the p-values of their association with cibersort: Mast cell activated to WebGestalt.
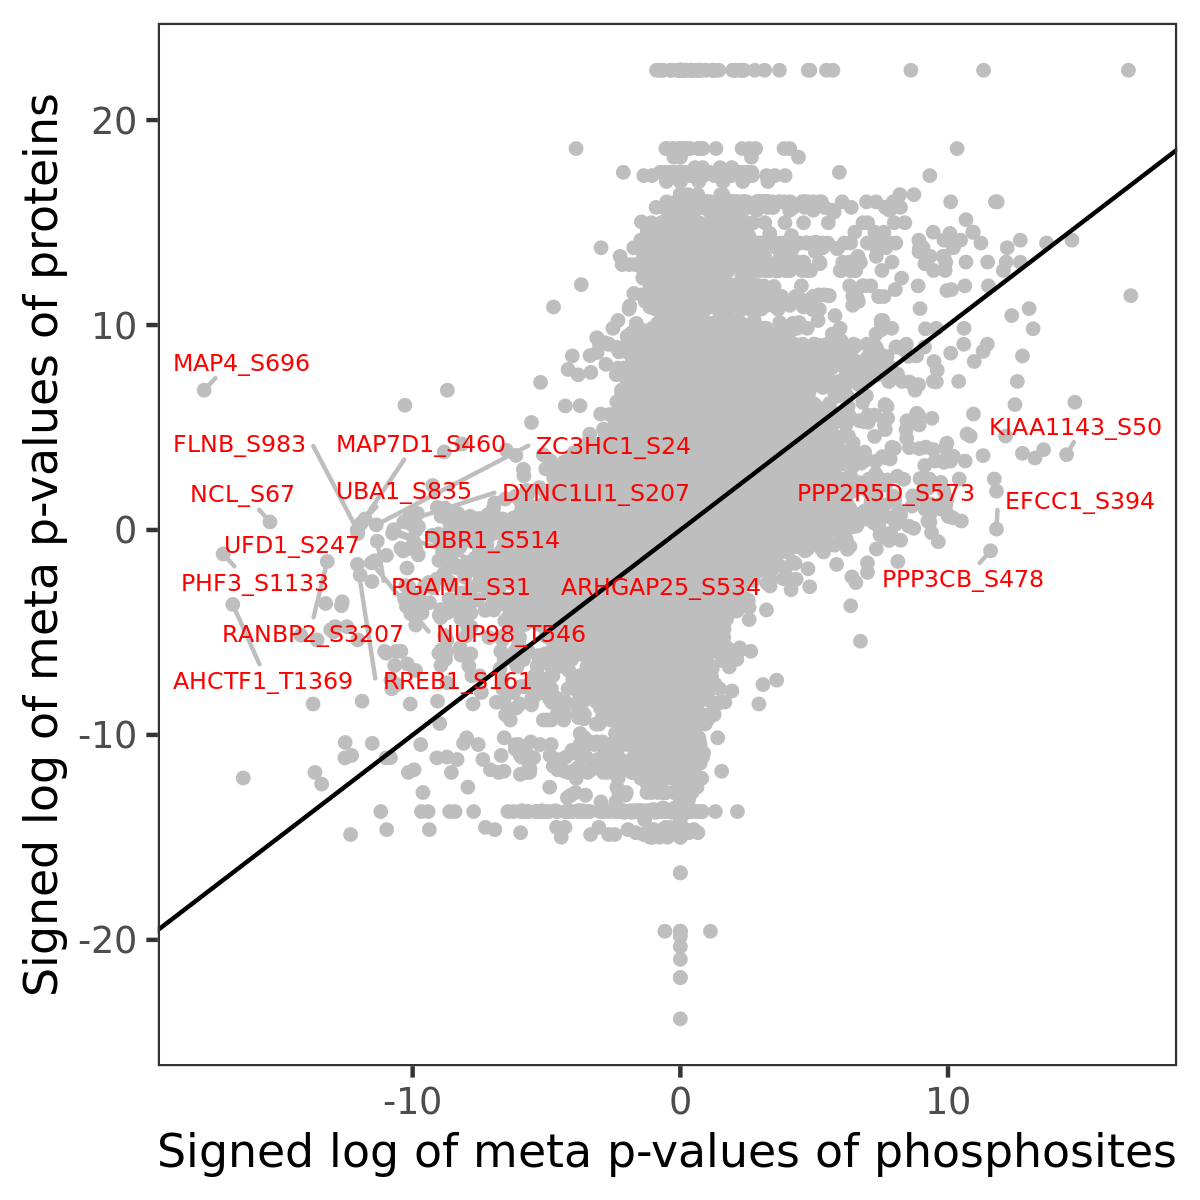
Phosphosite association
Number of significant genes with P-value ≤ 10-6 for each cohorts are summarized in the bar plot. The scatter plot highlights significant associations diven by phosphorylation rather than protein abundance.
| Signed p-values | |||||||||||||
|---|---|---|---|---|---|---|---|---|---|---|---|---|---|
| Gene | Protein | Site | Meta P | BRCA | CCRCC | COAD | GBM | HNSCC | LSCC | LUAD | OV | PDAC | UCEC |
Gene set enrichment analysis
Submit phosphorylation sites and the common logarithm of the p-values of their association with cibersort: Mast cell activated to WebGestalt.