Basic information
- Phenotype
- xcell: Macrophage M1
- Description
- Enrichment score inferring the proportion of M1 macrophages in the tumor derived from RNA data using the xCell tool.
- Source
- https://genomebiology.biomedcentral.com/articles/10.1186/s13059-017-1349-1
- Method
- The R package immunedeconv (V2.0.4) (PMID: 31510660) was used to perform immune cell deconvolution using RNA expression data (TPM).
- Genes
-
- ABI1
- ABTB2
- ACP2
- ACTR2
- ACTR3
- ADAMDEC1
- ADCK2
- ADCY3
- ADO
- ADRA2B
- AFG3L2
- AGPS
- ALCAM
- ANXA2
- AP1M2
- ARHGEF11
- ARL8B
- ATOX1
- ATP6V0C
- ATP6V1A
- ATP6V1D
- ATP6V1E1
- ATP6V1F
- ATP6V1H
- BCAP31
- BCKDK
- BLVRA
- C1QA
- C1QB
- C3AR1
- CALR
- CCDC47
- CCL1
- CCL18
- CCL19
- CCL22
- CCL24
- CCL7
- CCL8
- CCR1
- CD163
- CD300C
- CD48
- CD63
- CD80
- CD84
- CHIT1
- CIAO1
- CLCN7
- CLEC4E
- CLPB
- CLTC
- CMKLR1
- COQ2
- CORO7
- COX5B
- CSF1
- CSF1R
- CXCL9
- CYBB
- CYC1
- CYFIP1
- CYP19A1
- DAGLA
- DLAT
- DNAJC13
- DNASE2B
- DOT1L
- EMILIN1
- EXOC5
- FAM32A
- FANCE
- FCER1G
- FDX1
- FKBP15
- FOLR2
- FPR2
- FPR3
- FTL
- GLRX2
- GP1BA
- GPD1
- HAMP
- HAUS2
- HEXB
- HK3
- HSPB7
- HYAL2
- IFNAR1
- IGSF6
- IL10
- IL12B
- IL17RA
- ITGAE
- ITGB1BP1
- KCNJ1
- KCNJ5
- KCNK13
- KIFC3
- LAIR1
- LAMP1
- LILRB1
- LILRB4
- LIMD2
- LONP1
- LONRF3
- MAPK13
- MARCO
- MMP19
- MRPL12
- MRPL40
- MRS2
- MS4A4A
- MSR1
- MT2A
- MYBPH
- MYH11
- MYO7A
- MYOF
- MYOZ1
- NCAPH
- NDUFAF1
- NDUFS2
- NECAP2
- NRBP1
- OGFR
- OTUD4
- P2RX7
- PDCL
- PHLDB1
- PKD2L1
- PLEKHB2
- PRDX1
- PTGIR
- PTPRA
- RAB3IL1
- RELA
- RNH1
- RRP1
- S100A11
- S1PR2
- SCAMP2
- SDS
- SIGLEC1
- SIGLEC7
- SIGLEC9
- SLAMF8
- SLC11A1
- SLC1A2
- SLC25A24
- SLC31A1
- SLC6A12
- SNX3
- SPG21
- SPR
- SRC
- STIP1
- STX12
- STX4
- TBC1D16
- TDRD7
- TFEC
- TFRC
- TIE1
- TMEM33
- TMEM70
- TMX1
- TPP1
- TREM2
- TRIP4
- TSPO
- UQCR11
- USP14
- UTP3
- VIM
- VPS33A
- VSIG4
- WDR11
- WSB2
- WTAP
- ZC3H15
- ZMPSTE24
- More...
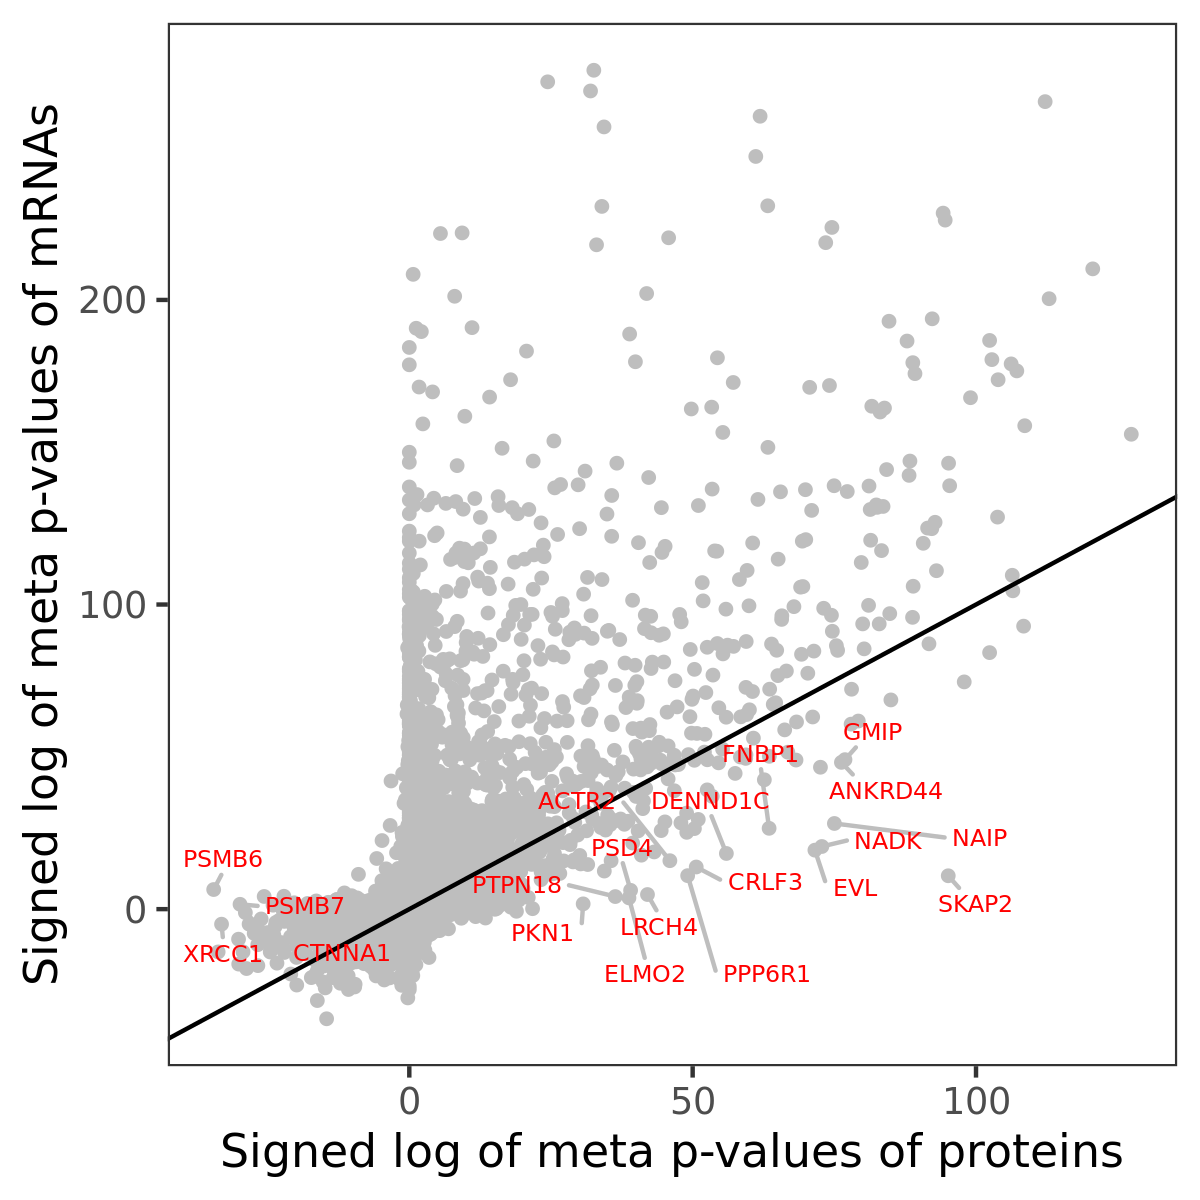
Gene association
Number of significant genes with P-value ≤ 10-6 for each cohorts are summarized in bar plots. The scatter plot highlights significant associations diven by protein rather than mRNA abundance.
Association of protein abundance of genes
Signed p-values | ||||||||||||
|---|---|---|---|---|---|---|---|---|---|---|---|---|
Gene | Meta P | BRCA | CCRCC | COAD | GBM | HNSCC | LSCC | LUAD | OV | PDAC | UCEC | |
| No matching records found | ||||||||||||
Gene set enrichment analysis
Submit genes and the common logarithm of the p-values of their association with xcell: Macrophage M1 to WebGestalt.
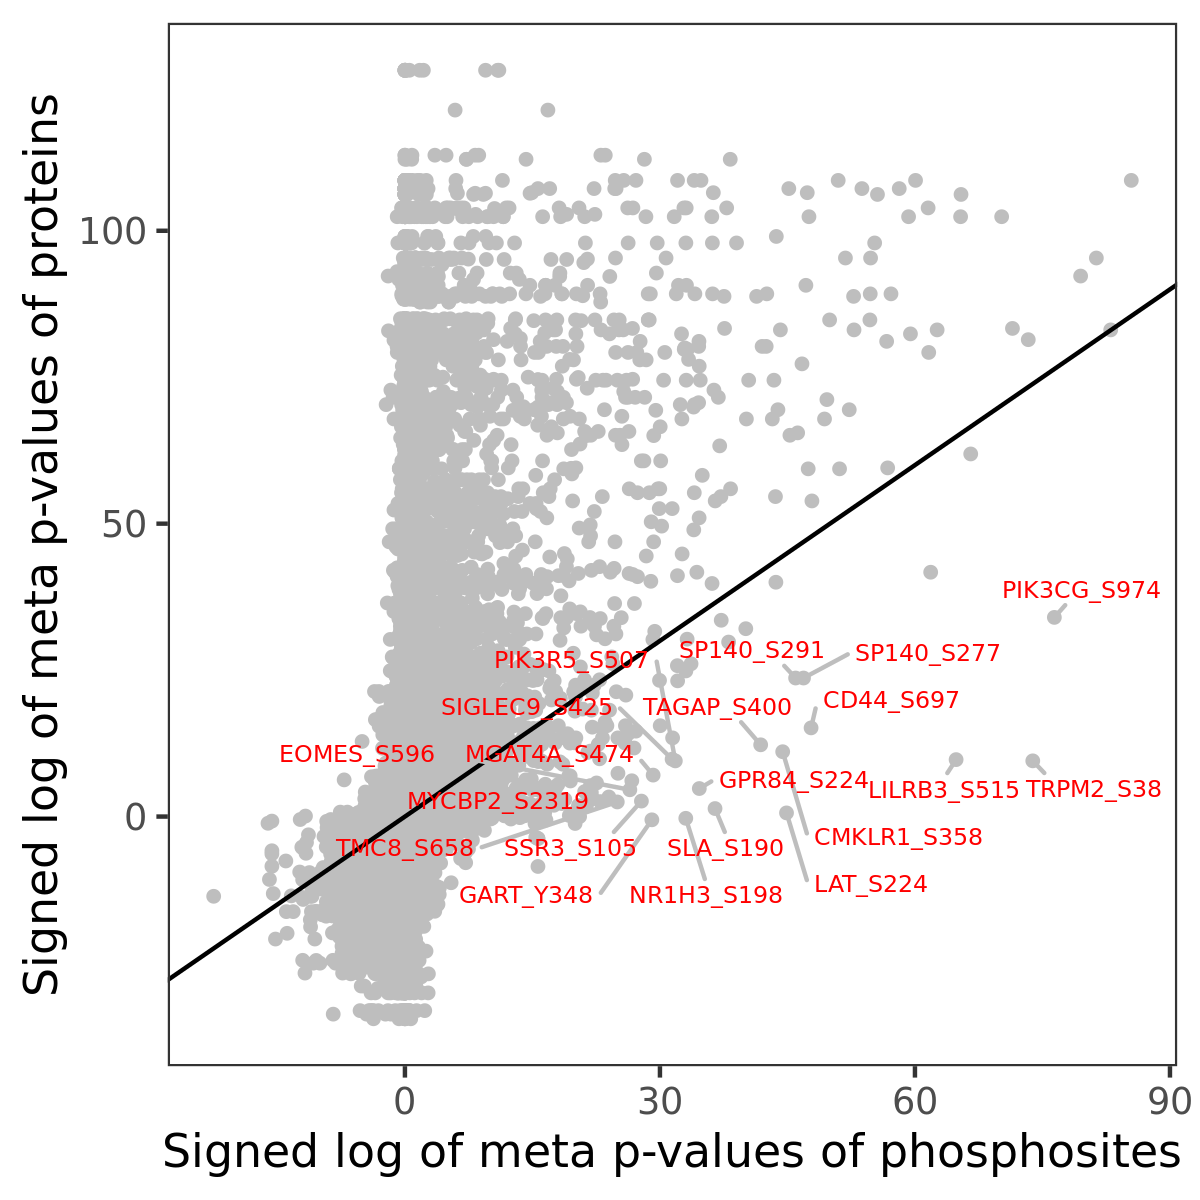
Phosphosite association
Number of significant genes with P-value ≤ 10-6 for each cohorts are summarized in the bar plot. The scatter plot highlights significant associations diven by phosphorylation rather than protein abundance.
Signed p-values | |||||||||||||
|---|---|---|---|---|---|---|---|---|---|---|---|---|---|
Gene | Protein | Site | Meta P | BRCA | CCRCC | COAD | GBM | HNSCC | LSCC | LUAD | OV | PDAC | UCEC |
| No matching records found | |||||||||||||
Gene set enrichment analysis
Submit phosphorylation sites and the common logarithm of the p-values of their association with xcell: Macrophage M1 to WebGestalt.