Basic information
- Phenotype
- ESTIMATE: ImmuneScore
- Description
- Score that represents the amount of immune infiltration in a tumor sample. Calculated from RNA expression data using the ESTIMATE tool. The RNA data were filtered to genes with expression in at least 50% of the samples in a cohort.
- Source
- https://www.nature.com/articles/ncomms3612
- Method
- The ESTIMATE scores reflecting the overall immune and stromal infiltration were calculated by the R package ESTIMATE (PMID: 24113773) using the normalized RNA expression data (RSEM). We removed genes with 0 expression in >=50% samples of a cohort.
- Genes
-
- ADCY7
- ALOX5AP
- AOAH
- ARHGAP15
- ARHGDIB
- ARHGEF6
- BCL2A1
- BIN2
- CASP1
- CCDC69
- CCL5
- CCR7
- CD2
- CD247
- CD27
- CD300A
- CD302
- CD37
- CD3D
- CD48
- CD52
- CD53
- CD69
- CD74
- CLEC2B
- CLEC4A
- CORO1A
- CST7
- CSTA
- CTSS
- CYBB
- DOCK2
- EMP3
- EVI2B
- FCER1G
- FGL2
- FGR
- FLI1
- FYB1
- GBP1
- GBP2
- GIMAP4
- GIMAP6
- GLRX
- GMFG
- GMIP
- GNLY
- GPR65
- GZMB
- GZMH
- GZMK
- HCK
- HCLS1
- HLA-B
- HLA-DMA
- HLA-DPA1
- HLA-DPB1
- HLA-DRA
- HLA-E
- HLA-F
- HLA-G
- IFI30
- IKZF1
- IL10RA
- IL18RAP
- IL2RB
- IL2RG
- IL32
- IL4R
- IL7R
- IRF8
- ITGA4
- ITGAL
- ITGB2
- ITK
- KLRB1
- KLRK1
- LAIR1
- LAPTM5
- LCK
- LCP2
- LGALS9
- LILRB1
- LILRB2
- LPXN
- LSP1
- LST1
- LTB
- LY96
- LYZ
- MAFB
- MFSD1
- MICAL1
- MNDA
- MSN
- MYO1F
- NCF2
- NCF4
- NCKAP1L
- NFKBIA
- NKG7
- P2RY14
- PLEK
- PRF1
- PSTPIP1
- PTGER2
- PTGER4
- PTPRC
- PTPRCAP
- PTPRE
- PVRIG
- RAB27A
- RABGAP1L
- RAC2
- RASSF2
- RGS1
- RHOG
- RHOH
- RNASE6
- S100A8
- S100A9
- SAMHD1
- SELL
- SELPLG
- SH2B3
- SLA
- SRGN
- TAP1
- TCIRG1
- TGFB1
- TNFAIP3
- TNFRSF1B
- TPP1
- TPST2
- TRAF3IP3
- TYROBP
- VAV1
- VNN2
- WIPF1
- ZAP70
- More...
Gene association
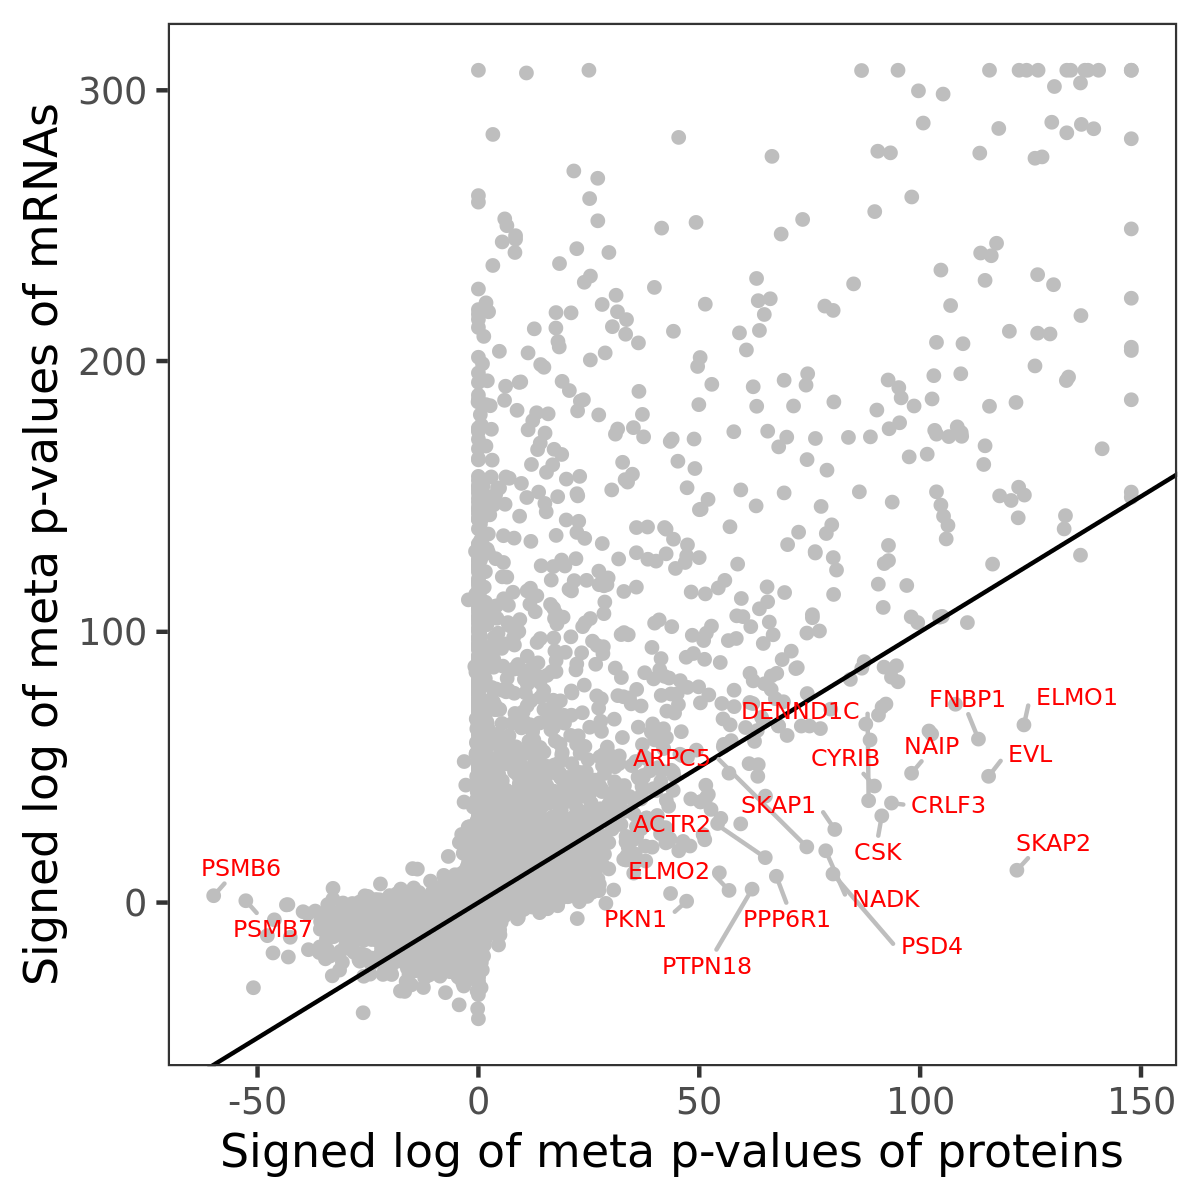
Number of significant genes with P-value ≤ 10-6 for each cohorts are summarized in bar plots. The scatter plot highlights significant associations diven by protein rather than mRNA abundance.
Association of protein abundance of genes
| Signed p-values | |||||||||||
|---|---|---|---|---|---|---|---|---|---|---|---|
| Gene | Meta P | BRCA | CCRCC | COAD | GBM | HNSCC | LSCC | LUAD | OV | PDAC | UCEC |
Gene set enrichment analysis
Submit genes and the common logarithm of the p-values of their association with ESTIMATE: ImmuneScore to WebGestalt.
Phosphosite association
Number of significant genes with P-value ≤ 10-6 for each cohorts are summarized in the bar plot. The scatter plot highlights significant associations diven by phosphorylation rather than protein abundance.

| Signed p-values | |||||||||||||
|---|---|---|---|---|---|---|---|---|---|---|---|---|---|
| Gene | Protein | Site | Meta P | BRCA | CCRCC | COAD | GBM | HNSCC | LSCC | LUAD | OV | PDAC | UCEC |
Gene set enrichment analysis
Submit phosphorylation sites and the common logarithm of the p-values of their association with ESTIMATE: ImmuneScore to WebGestalt.