Basic information
- Phenotype
- HALLMARK_HYPOXIA
- Description
- Enrichment score representing the pathway induced by hypoxia. The score was calculated using ssGSEA on the RNA data (Z-score transformed coding genes with expression in at least 50% of the samples in a cohort).
- Source
- http://www.gsea-msigdb.org/gsea/msigdb/cards/HALLMARK_HYPOXIA.html
- Method
- Single sample gene set enrichment analysis (ssGSEA) was performed for each cancer type using gene-wise Z-scores of the RNA expression data (RSEM) for the MSigDB Hallmark gene sets v7.0 (PMID: 26771021) via the ssGSEA2.0 R package (PMID: 30563849). RNA data were filtered to coding genes with < 50% 0 expression. (Parameters: sample.norm.type="rank", weight=0.75, statistic="area.under.RES", nperm=1000, min.overlap=10). Pathway activity scores are normalized enrichment scores from ssGSEA.
- Genes
-
- ADM
- ADORA2B
- AK4
- AKAP12
- ALDOA
- ALDOB
- ALDOC
- AMPD3
- ANGPTL4
- ANKZF1
- ANXA2
- ATF3
- ATP7A
- B3GALT6
- B4GALNT2
- BCAN
- BCL2
- BGN
- BHLHE40
- BNIP3L
- BRS3
- BTG1
- CA12
- CASP6
- CAV1
- CAVIN1
- CAVIN3
- CCN1
- CCN2
- CCN5
- CCNG2
- CDKN1A
- CDKN1B
- CDKN1C
- CHST2
- CHST3
- CITED2
- COL5A1
- CP
- CSRP2
- CXCR4
- DCN
- DDIT3
- DDIT4
- DPYSL4
- DTNA
- DUSP1
- EDN2
- EFNA1
- EFNA3
- EGFR
- ENO1
- ENO2
- ENO3
- ERO1A
- ERRFI1
- ETS1
- EXT1
- F3
- FAM162A
- FBP1
- FOS
- FOSL2
- FOXO3
- GAA
- GALK1
- GAPDH
- GAPDHS
- GBE1
- GCK
- GCNT2
- GLRX
- GPC1
- GPC3
- GPC4
- GPI
- GRHPR
- GYS1
- HAS1
- HDLBP
- HEXA
- HK1
- HK2
- HMOX1
- HOXB9
- HS3ST1
- HSPA5
- IDS
- IER3
- IGFBP1
- IGFBP3
- IL6
- ILVBL
- INHA
- IRS2
- ISG20
- JMJD6
- JUN
- KDELR3
- KDM3A
- KIF5A
- KLF6
- KLF7
- KLHL24
- LALBA
- LARGE1
- LDHA
- LDHC
- LOX
- LXN
- MAFF
- MAP3K1
- MIF
- MT1E
- MT2A
- MXI1
- MYH9
- NAGK
- NCAN
- NDRG1
- NDST1
- NDST2
- NEDD4L
- NFIL3
- NOCT
- NR3C1
- P4HA1
- P4HA2
- PAM
- PCK1
- PDGFB
- PDK1
- PDK3
- PFKFB3
- PFKL
- PFKP
- PGAM2
- PGF
- PGK1
- PGM1
- PGM2
- PHKG1
- PIM1
- PKLR
- PKP1
- PLAC8
- PLAUR
- PLIN2
- PNRC1
- PPARGC1A
- PPFIA4
- PPP1R15A
- PPP1R3C
- PRDX5
- PRKCA
- PYGM
- RBPJ
- RORA
- RRAGD
- S100A4
- SAP30
- SCARB1
- SDC2
- SDC3
- SDC4
- SELENBP1
- SERPINE1
- SIAH2
- SLC25A1
- SLC2A1
- SLC2A3
- SLC2A5
- SLC37A4
- SLC6A6
- SRPX
- STBD1
- STC1
- STC2
- SULT2B1
- TES
- TGFB3
- TGFBI
- TGM2
- TIPARP
- TKTL1
- TMEM45A
- TNFAIP3
- TPBG
- TPD52
- TPI1
- TPST2
- UGP2
- VEGFA
- VHL
- VLDLR
- WSB1
- XPNPEP1
- ZFP36
- ZNF292
- More...
Gene association
Number of significant genes with P-value ≤ 10-6 for each cohorts are summarized in bar plots. The scatter plot highlights significant associations diven by protein rather than mRNA abundance.
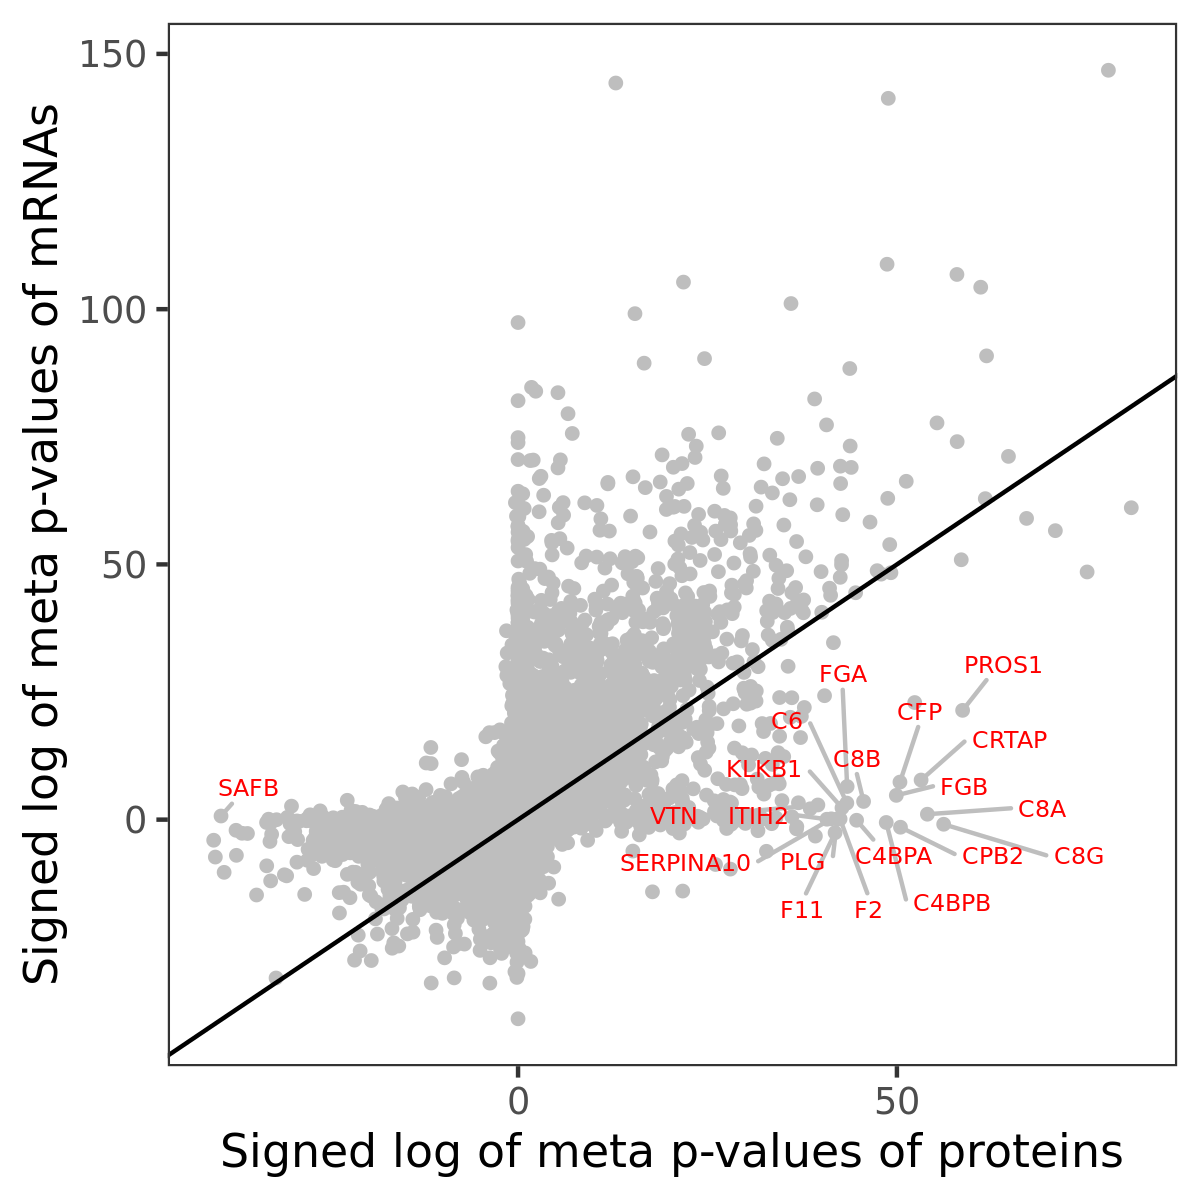
Association of protein abundance of genes
| Signed p-values | |||||||||||
|---|---|---|---|---|---|---|---|---|---|---|---|
| Gene | Meta P | BRCA | CCRCC | COAD | GBM | HNSCC | LSCC | LUAD | OV | PDAC | UCEC |
Gene set enrichment analysis
Submit genes and the common logarithm of the p-values of their association with HALLMARK_HYPOXIA to WebGestalt.
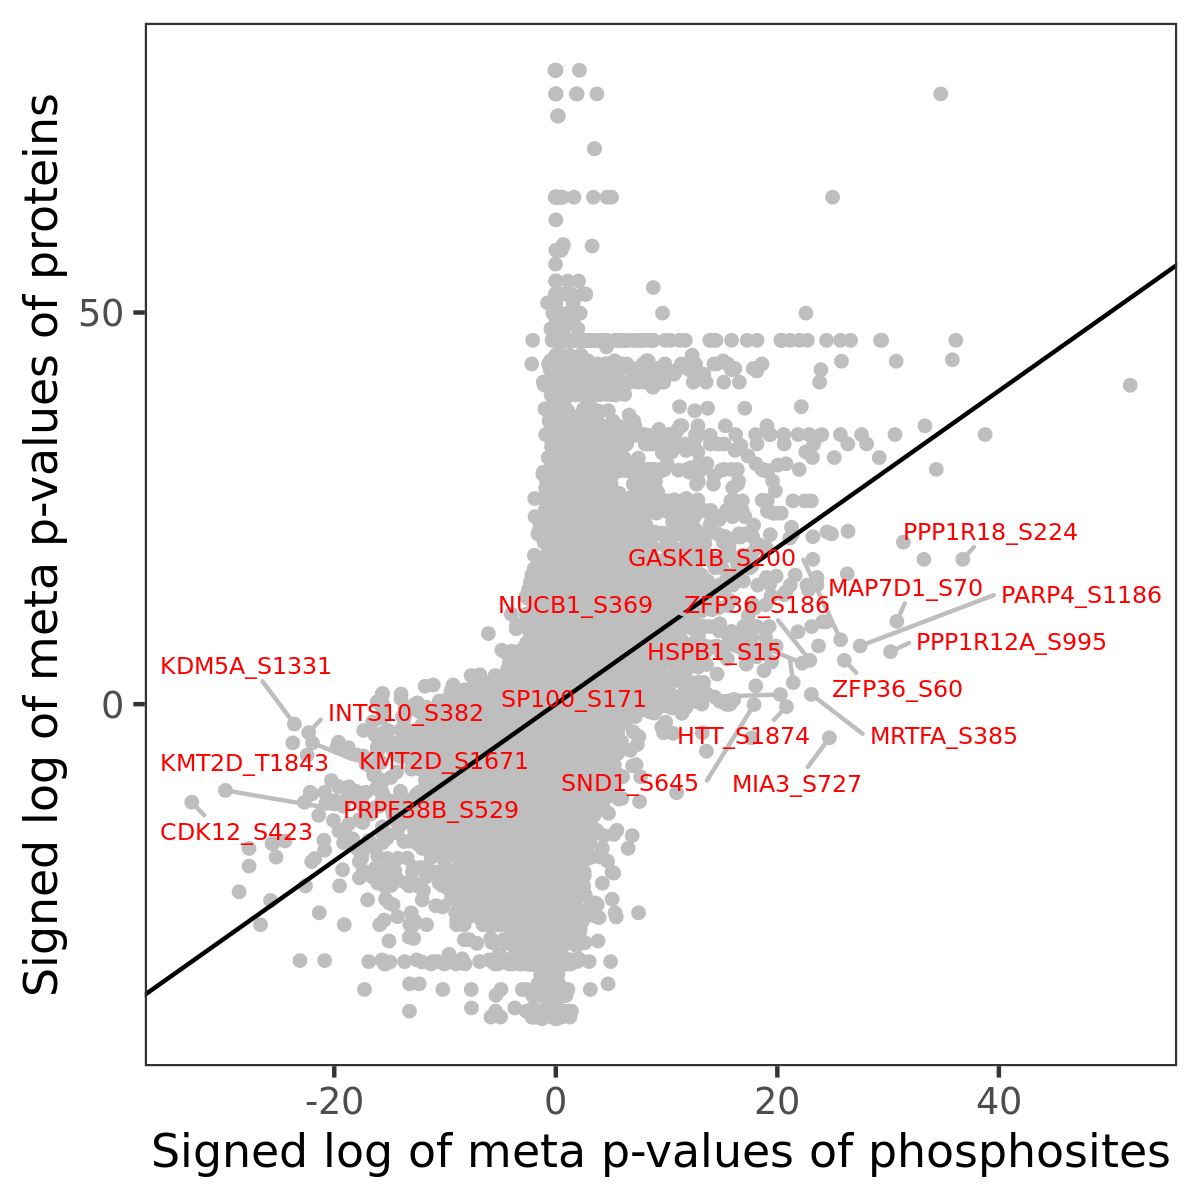
Phosphosite association
Number of significant genes with P-value ≤ 10-6 for each cohorts are summarized in the bar plot. The scatter plot highlights significant associations diven by phosphorylation rather than protein abundance.
| Signed p-values | |||||||||||||
|---|---|---|---|---|---|---|---|---|---|---|---|---|---|
| Gene | Protein | Site | Meta P | BRCA | CCRCC | COAD | GBM | HNSCC | LSCC | LUAD | OV | PDAC | UCEC |
Gene set enrichment analysis
Submit phosphorylation sites and the common logarithm of the p-values of their association with HALLMARK_HYPOXIA to WebGestalt.