Basic information
- Phenotype
- HALLMARK_IL2_STAT5_SIGNALING
- Description
- Enrichment score representing IL2/STAT5 signaling. The score was calculated using ssGSEA on the RNA data (Z-score transformed coding genes with expression in at least 50% of the samples in a cohort).
- Source
- http://www.gsea-msigdb.org/gsea/msigdb/cards/HALLMARK_IL2_STAT5_SIGNALING.html
- Method
- Single sample gene set enrichment analysis (ssGSEA) was performed for each cancer type using gene-wise Z-scores of the RNA expression data (RSEM) for the MSigDB Hallmark gene sets v7.0 (PMID: 26771021) via the ssGSEA2.0 R package (PMID: 30563849). RNA data were filtered to coding genes with < 50% 0 expression. (Parameters: sample.norm.type="rank", weight=0.75, statistic="area.under.RES", nperm=1000, min.overlap=10). Pathway activity scores are normalized enrichment scores from ssGSEA.
- Genes
-
- ADAM19
- AGER
- AHCY
- AHNAK
- AHR
- ALCAM
- AMACR
- ANXA4
- APLP1
- ARL4A
- BATF
- BATF3
- BCL2
- BCL2L1
- BHLHE40
- BMP2
- BMPR2
- CA2
- CAPG
- CAPN3
- CASP3
- CCND2
- CCND3
- CCNE1
- CCR4
- CD44
- CD48
- CD79B
- CD81
- CD83
- CD86
- CDC42SE2
- CDC6
- CDCP1
- CDKN1C
- CISH
- CKAP4
- COCH
- COL6A1
- CSF1
- CSF2
- CST7
- CTLA4
- CTSZ
- CXCL10
- CYFIP1
- DCPS
- DENND5A
- DHRS3
- DRC1
- ECM1
- EEF1AKMT1
- EMP1
- ENO3
- ENPP1
- EOMES
- ETFBKMT
- ETV4
- F2RL2
- FAH
- FAM126B
- FGL2
- FLT3LG
- FURIN
- GABARAPL1
- GADD45B
- GALM
- GATA1
- GBP4
- GLIPR2
- GPR65
- GPR83
- GPX4
- GSTO1
- GUCY1B1
- HIPK2
- HK2
- HOPX
- HUWE1
- ICOS
- IFITM3
- IFNGR1
- IGF1R
- IGF2R
- IKZF2
- IKZF4
- IL10
- IL10RA
- IL13
- IL18R1
- IL1R2
- IL1RL1
- IL2RA
- IL2RB
- IL3RA_PAR_Y
- IL4R
- IRF4
- IRF6
- IRF8
- ITGA6
- ITGAE
- ITGAV
- ITIH5
- KLF6
- LCLAT1
- LIF
- LRIG1
- LRRC8C
- LTB
- MAFF
- MAP3K8
- MAP6
- MAPKAPK2
- MUC1
- MXD1
- MYC
- MYO1C
- MYO1E
- NCOA3
- NCS1
- NDRG1
- NFIL3
- NFKBIZ
- NOP2
- NRP1
- NT5E
- ODC1
- P2RX4
- P4HA1
- PDCD2L
- PENK
- PHLDA1
- PHTF2
- PIM1
- PLAGL1
- PLEC
- PLIN2
- PLPP1
- PLSCR1
- PNP
- POU2F1
- PRAF2
- PRKCH
- PRNP
- PTCH1
- PTGER2
- PTH1R
- PTRH2
- PUS1
- RABGAP1L
- RGS16
- RHOB
- RHOH
- RNH1
- RORA
- RRAGD
- S100A1
- SCN9A
- SELL
- SELP
- SERPINB6
- SERPINC1
- SH3BGRL2
- SHE
- SLC1A5
- SLC29A2
- SLC2A3
- SLC39A8
- SMPDL3A
- SNX14
- SNX9
- SOCS1
- SOCS2
- SPP1
- SPRED2
- SPRY4
- ST3GAL4
- SWAP70
- SYNGR2
- SYT11
- TGM2
- TIAM1
- TLR7
- TNFRSF18
- TNFRSF1B
- TNFRSF21
- TNFRSF4
- TNFRSF8
- TNFRSF9
- TNFSF10
- TNFSF11
- TRAF1
- TTC39B
- TWSG1
- UCK2
- UMPS
- WLS
- XBP1
- More...
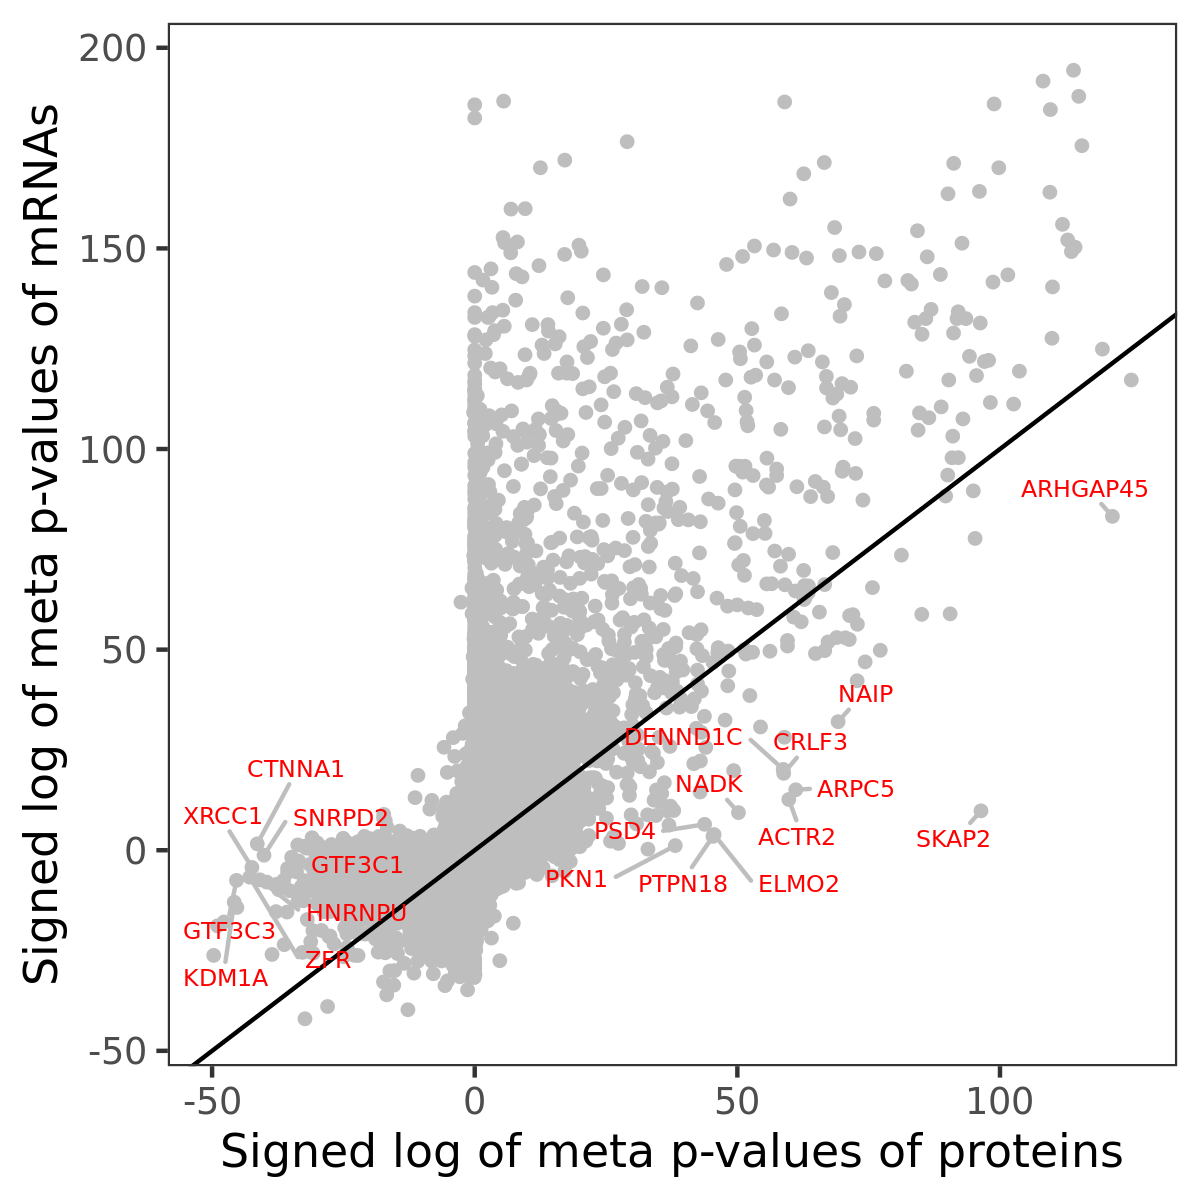
Gene association
Number of significant genes with P-value ≤ 10-6 for each cohorts are summarized in bar plots. The scatter plot highlights significant associations diven by protein rather than mRNA abundance.
Association of protein abundance of genes
| Signed p-values | |||||||||||
|---|---|---|---|---|---|---|---|---|---|---|---|
| Gene | Meta P | BRCA | CCRCC | COAD | GBM | HNSCC | LSCC | LUAD | OV | PDAC | UCEC |
Gene set enrichment analysis
Submit genes and the common logarithm of the p-values of their association with HALLMARK_IL2_STAT5_SIGNALING to WebGestalt.
Phosphosite association
Number of significant genes with P-value ≤ 10-6 for each cohorts are summarized in the bar plot. The scatter plot highlights significant associations diven by phosphorylation rather than protein abundance.

| Signed p-values | |||||||||||||
|---|---|---|---|---|---|---|---|---|---|---|---|---|---|
| Gene | Protein | Site | Meta P | BRCA | CCRCC | COAD | GBM | HNSCC | LSCC | LUAD | OV | PDAC | UCEC |
Gene set enrichment analysis
Submit phosphorylation sites and the common logarithm of the p-values of their association with HALLMARK_IL2_STAT5_SIGNALING to WebGestalt.