Basic information
- Phenotype
- HALLMARK_KRAS_SIGNALING_DN
- Description
- Enrichment score representing genes decreased by KRAS activation. The score was calculated using ssGSEA on the RNA data (Z-score transformed coding genes with expression in at least 50% of the samples in a cohort).
- Source
- http://www.gsea-msigdb.org/gsea/msigdb/cards/HALLMARK_KRAS_SIGNALING_DN.html
- Method
- Single sample gene set enrichment analysis (ssGSEA) was performed for each cancer type using gene-wise Z-scores of the RNA expression data (RSEM) for the MSigDB Hallmark gene sets v7.0 (PMID: 26771021) via the ssGSEA2.0 R package (PMID: 30563849). RNA data were filtered to coding genes with < 50% 0 expression. (Parameters: sample.norm.type="rank", weight=0.75, statistic="area.under.RES", nperm=1000, min.overlap=10). Pathway activity scores are normalized enrichment scores from ssGSEA.
- Genes
-
- ABCG4
- ACTC1
- ADRA2C
- AKR1B10
- ALOX12B
- AMBN
- ARHGDIG
- ARPP21
- ASB7
- ATP4A
- ATP6V1B1
- BARD1
- BMPR1B
- BRDT
- BTG2
- C5
- CACNA1F
- CACNG1
- CALCB
- CALML5
- CAMK1D
- CAPN9
- CCDC106
- CCNA1
- CCR8
- CD207
- CD40LG
- CD80
- CDH16
- CDKAL1
- CELSR2
- CHRNG
- CHST2
- CKM
- CLDN16
- CLDN8
- CLPS
- CLSTN3
- CNTFR
- COL2A1
- COPZ2
- COQ8A
- CPA2
- CPB1
- CPEB3
- CYP11B2
- CYP39A1
- DCC
- DLK2
- DTNB
- EDAR
- EDN1
- EDN2
- EFHD1
- EGF
- ENTPD7
- EPHA5
- FGF16
- FGF22
- FGFR3
- FGGY
- FSHB
- GAMT
- GDNF
- GP1BA
- GP2
- GPR19
- GPR3
- GPRC5C
- GRID2
- GTF3C5
- HNF1A
- HSD11B2
- HTR1B
- HTR1D
- IDUA
- IFI44L
- IFNG
- IGFBP2
- IL12B
- IL5
- INSL5
- IRS4
- ITGB1BP2
- ITIH3
- KCND1
- KCNE2
- KCNMB1
- KCNN1
- KCNQ2
- KLHDC8A
- KLK7
- KLK8
- KMT2D
- KRT1
- KRT13
- KRT15
- KRT4
- KRT5
- LFNG
- LGALS7
- LYPD3
- MACROH2A2
- MAGIX
- MAST3
- MEFV
- MFSD6
- MSH5
- MTHFR
- MX1
- MYH7
- MYO15A
- MYOT
- NGB
- NOS1
- NPHS1
- NPY4R
- NR4A2
- NR6A1
- NRIP2
- NTF3
- NUDT11
- OXT
- P2RX6
- P2RY4
- PAX3
- PAX4
- PCDHB1
- PDCD1
- PDE6B
- PDK2
- PKP1
- PLAG1
- PNMT
- PRKN
- PRODH
- PROP1
- PTGFR
- PTPRJ
- RGS11
- RIBC2
- RSAD2
- RYR1
- RYR2
- SCGB1A1
- SCN10A
- SELENOP
- SERPINA10
- SERPINB2
- SGK1
- SHOX2
- SIDT1
- SKIL
- SLC12A3
- SLC16A7
- SLC25A23
- SLC29A3
- SLC30A3
- SLC38A3
- SLC5A5
- SLC6A14
- SLC6A3
- SMPX
- SNCB
- SNN
- SOX10
- SPHK2
- SPRR3
- SPTBN2
- SSTR4
- STAG3
- SYNPO
- TAS2R4
- TCF7L1
- TCL1A
- TENM2
- TENT5C
- TEX15
- TFAP2B
- TFCP2L1
- TFF2
- TG
- TGFB2
- TGM1
- THNSL2
- THRB
- TLX1
- TNNI3
- TSHB
- UGT2B17
- UPK3B
- VPREB1
- VPS50
- WNT16
- YBX2
- YPEL1
- ZBTB16
- ZC2HC1C
- ZNF112
- More...
Gene association
Number of significant genes with P-value ≤ 10-6 for each cohorts are summarized in bar plots. The scatter plot highlights significant associations diven by protein rather than mRNA abundance.
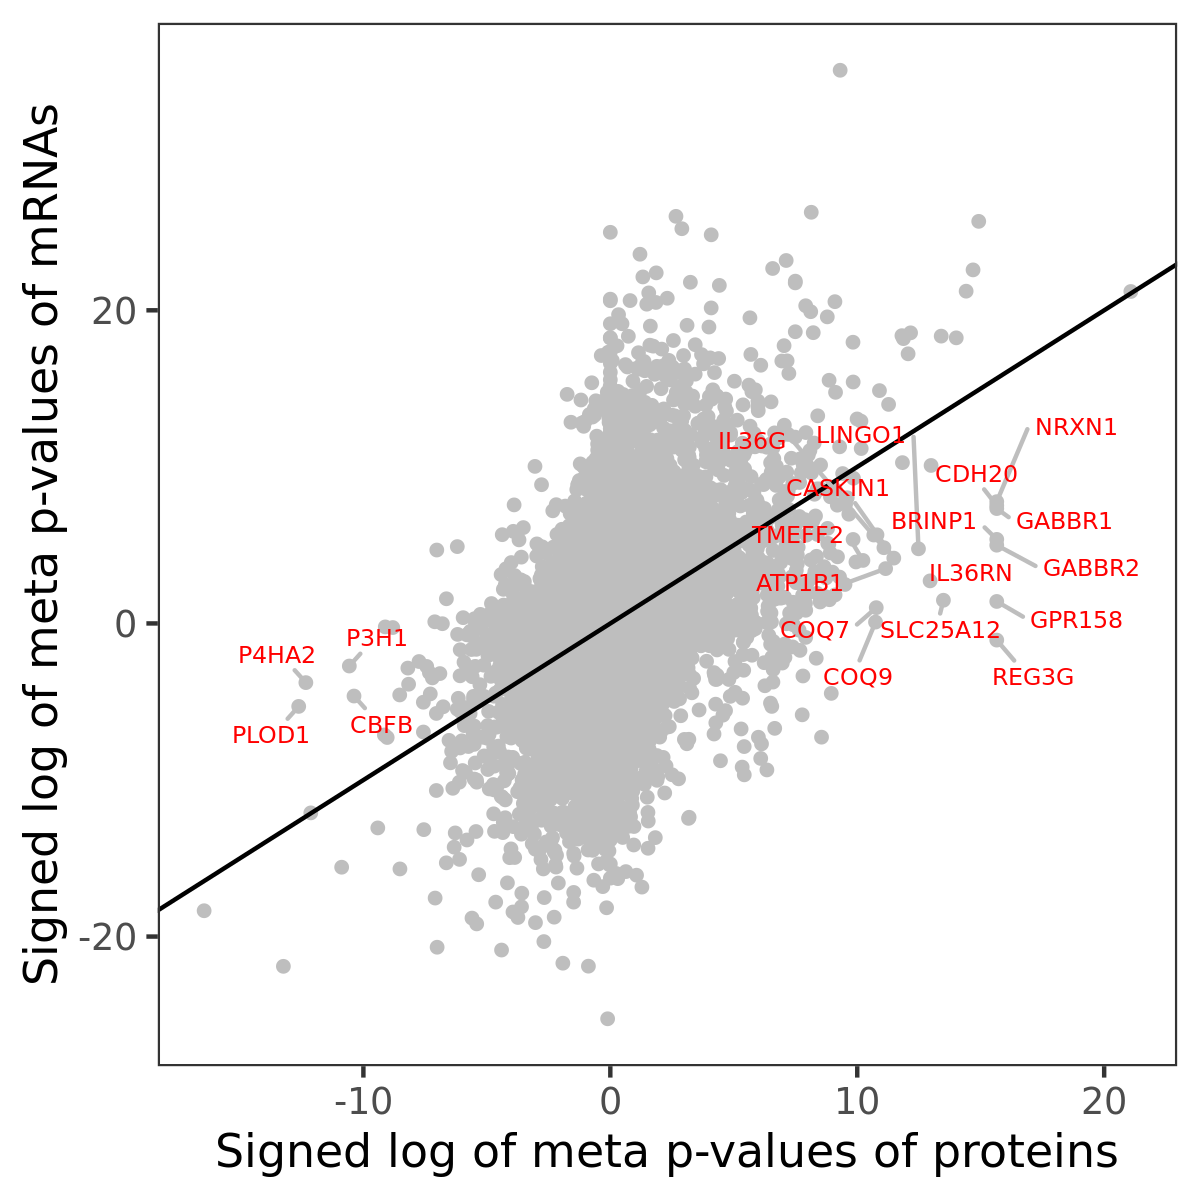
Association of protein abundance of genes
Signed p-values | ||||||||||||
|---|---|---|---|---|---|---|---|---|---|---|---|---|
Gene | Meta P | BRCA | CCRCC | COAD | GBM | HNSCC | LSCC | LUAD | OV | PDAC | UCEC | |
| No matching records found | ||||||||||||
Gene set enrichment analysis
Submit genes and the common logarithm of the p-values of their association with HALLMARK_KRAS_SIGNALING_DN to WebGestalt.
Phosphosite association
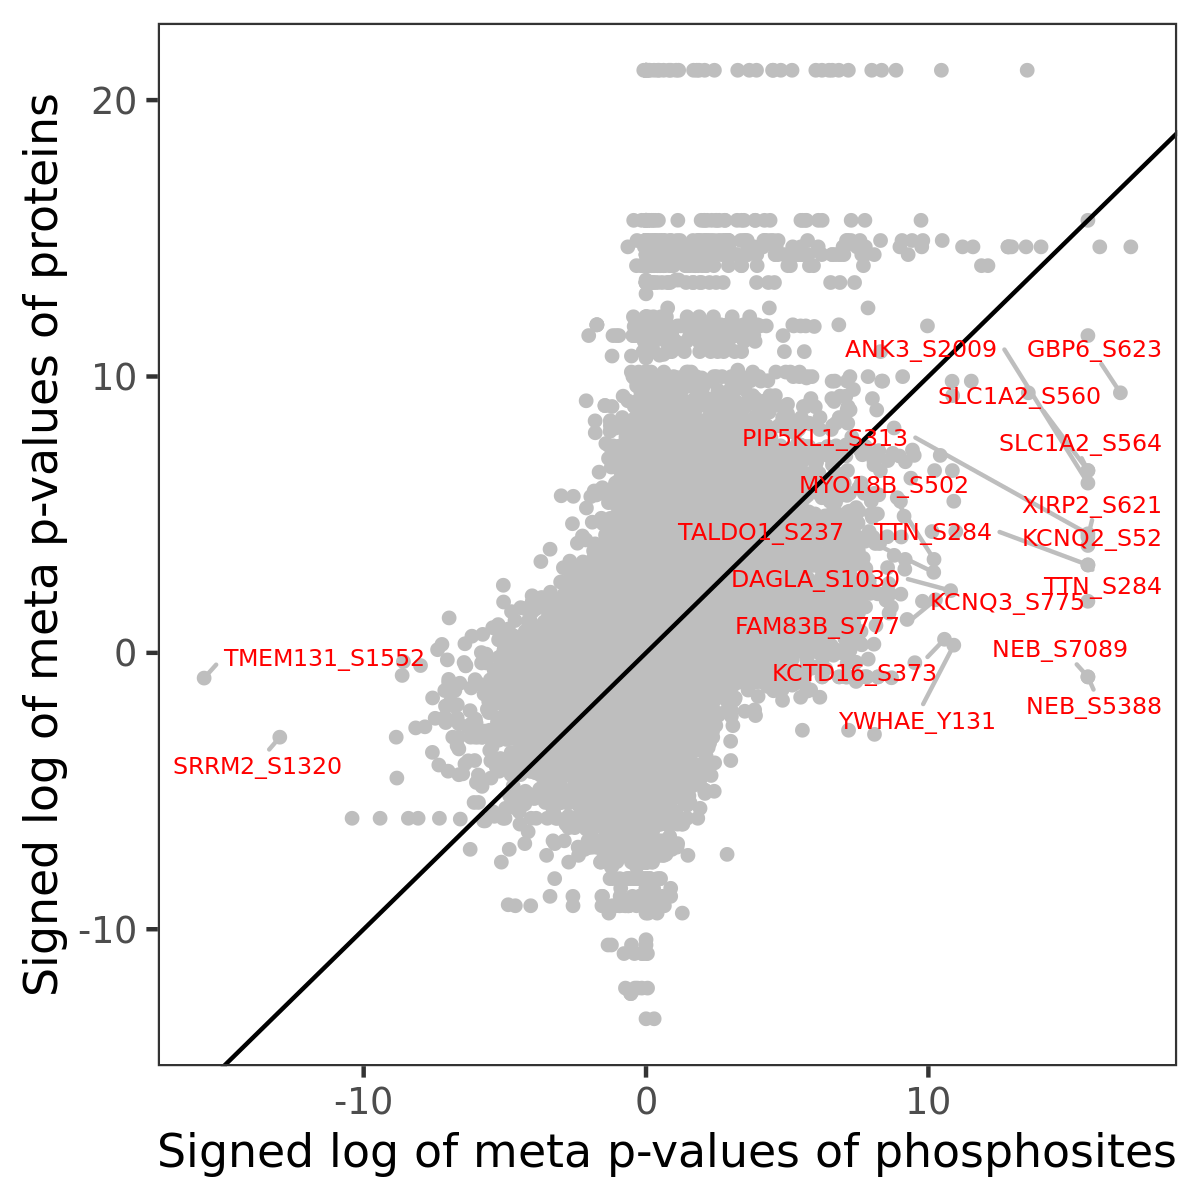
Number of significant genes with P-value ≤ 10-6 for each cohorts are summarized in the bar plot. The scatter plot highlights significant associations diven by phosphorylation rather than protein abundance.
Signed p-values | |||||||||||||
|---|---|---|---|---|---|---|---|---|---|---|---|---|---|
Gene | Protein | Site | Meta P | BRCA | CCRCC | COAD | GBM | HNSCC | LSCC | LUAD | OV | PDAC | UCEC |
| No matching records found | |||||||||||||
Gene set enrichment analysis
Submit phosphorylation sites and the common logarithm of the p-values of their association with HALLMARK_KRAS_SIGNALING_DN to WebGestalt.