Basic information
- Phenotype
- cibersort: Eosinophil
- Description
- Estimated fraction of eosinophils in the tumor compared to 21 other immune cells defined by CIBERSORT based on RNA expression data.
- Source
- https://www.nature.com/articles/nmeth.3337
- Method
- The R package immunedeconv (V2.0.4) (PMID: 31510660) was used to perform immune cell deconvolution using RNA expression data (TPM). CIBERSORT (PMID: 25822800) was performed in the ‘abs’ mode.
- Genes
-
- ACP5
- ADRB2
- ALOX5
- ANKRD55
- APOBEC3A
- BANK1
- BCL2A1
- BIRC3
- BMP2K
- BRAF
- C3AR1
- C5AR1
- CCL4
- CCR3
- CCR7
- CD2
- CD244
- CD300A
- CD37
- CD3D
- CD69
- CHST15
- CLC
- CPA3
- CST7
- DAPK2
- DEFA4
- DPEP2
- DUSP2
- EAF2
- EGR2
- FCER1A
- FCGR2B
- FFAR2
- FOSB
- FPR1
- GPR171
- GPR183
- GPR65
- HCK
- HDC
- HHEX
- HK3
- HSPA6
- IDO1
- IL18R1
- IL18RAP
- IL1A
- IL1B
- IL1RL1
- IL4R
- IL5RA
- ITK
- LILRB2
- LRMP
- LST1
- LTB
- LY86
- MMP25
- MMP9
- MNDA
- MS4A1
- MS4A3
- MXD1
- MYB
- NCF2
- NOD2
- NPL
- NR4A3
- OSM
- Array
- Array
- P2RX1
- P2RY10
- P2RY13
- P2RY14
- P2RY2
- PADI4
- PBXIP1
- PGLYRP1
- PIK3IP1
- PLEKHG3
- RASGRP2
- REPS2
- RGS1
- RGS13
- RNASE2
- RRP12
- RSAD2
- SAMSN1
- SELL
- SIK1
- SMPD3
- ST3GAL6
- TPSAB1
- Array
- SP140
- STAP1
- ZNF165
- More...
Gene association
Number of significant genes with P-value ≤ 10-6 for each cohorts are summarized in bar plots. The scatter plot highlights significant associations diven by protein rather than mRNA abundance.
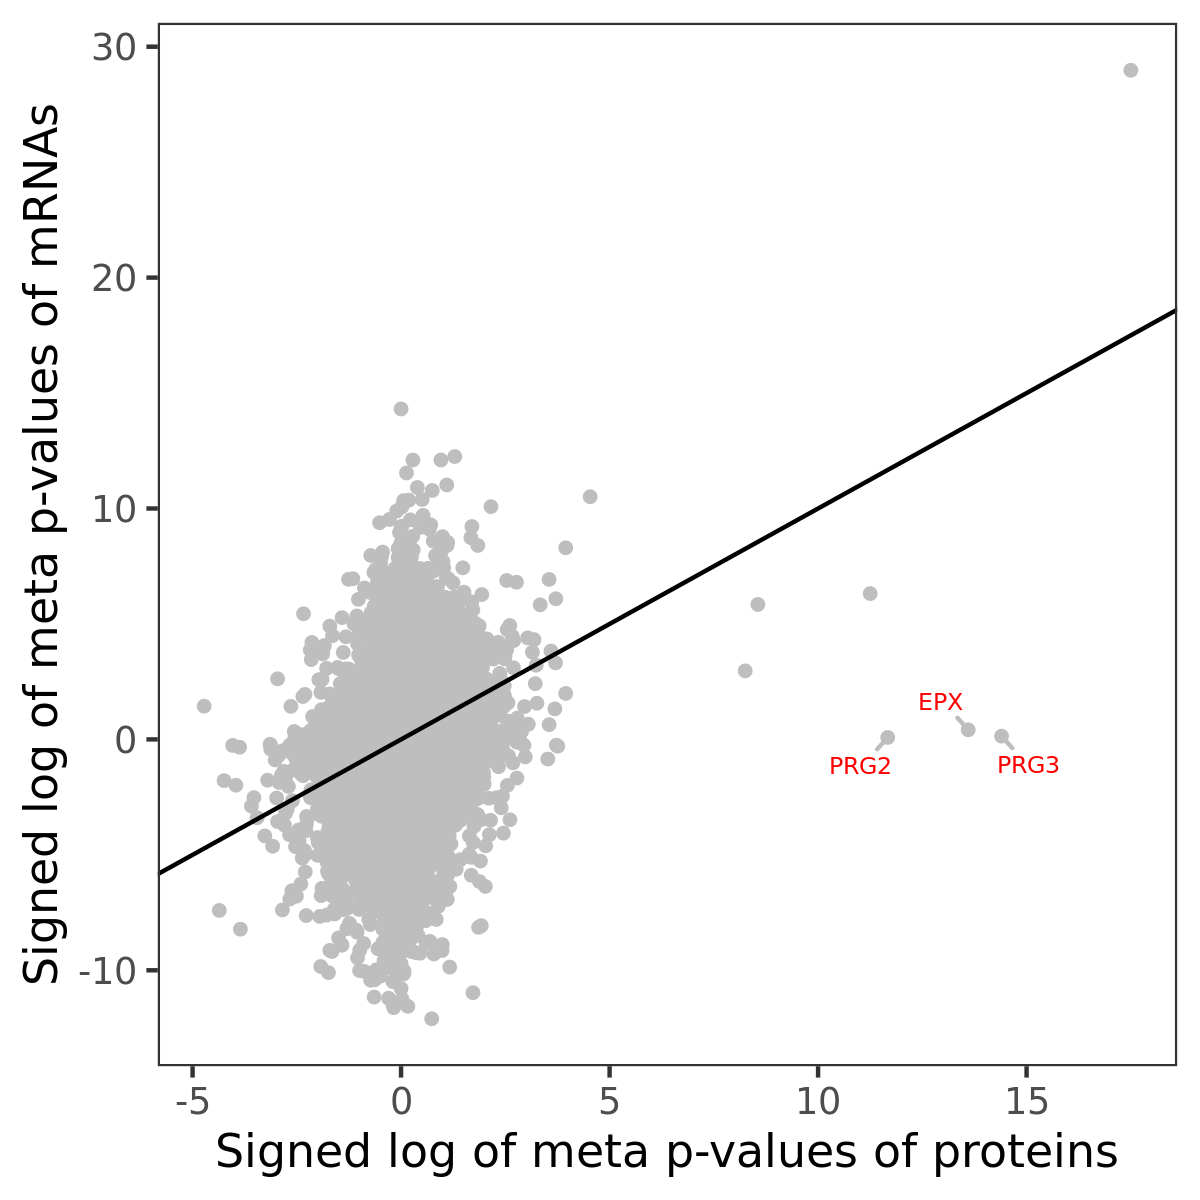
Association of protein abundance of genes
| Signed p-values | |||||||||||
|---|---|---|---|---|---|---|---|---|---|---|---|
| Gene | Meta P | BRCA | CCRCC | COAD | GBM | HNSCC | LSCC | LUAD | OV | PDAC | UCEC |
Gene set enrichment analysis
Submit genes and the common logarithm of the p-values of their association with cibersort: Eosinophil to WebGestalt.
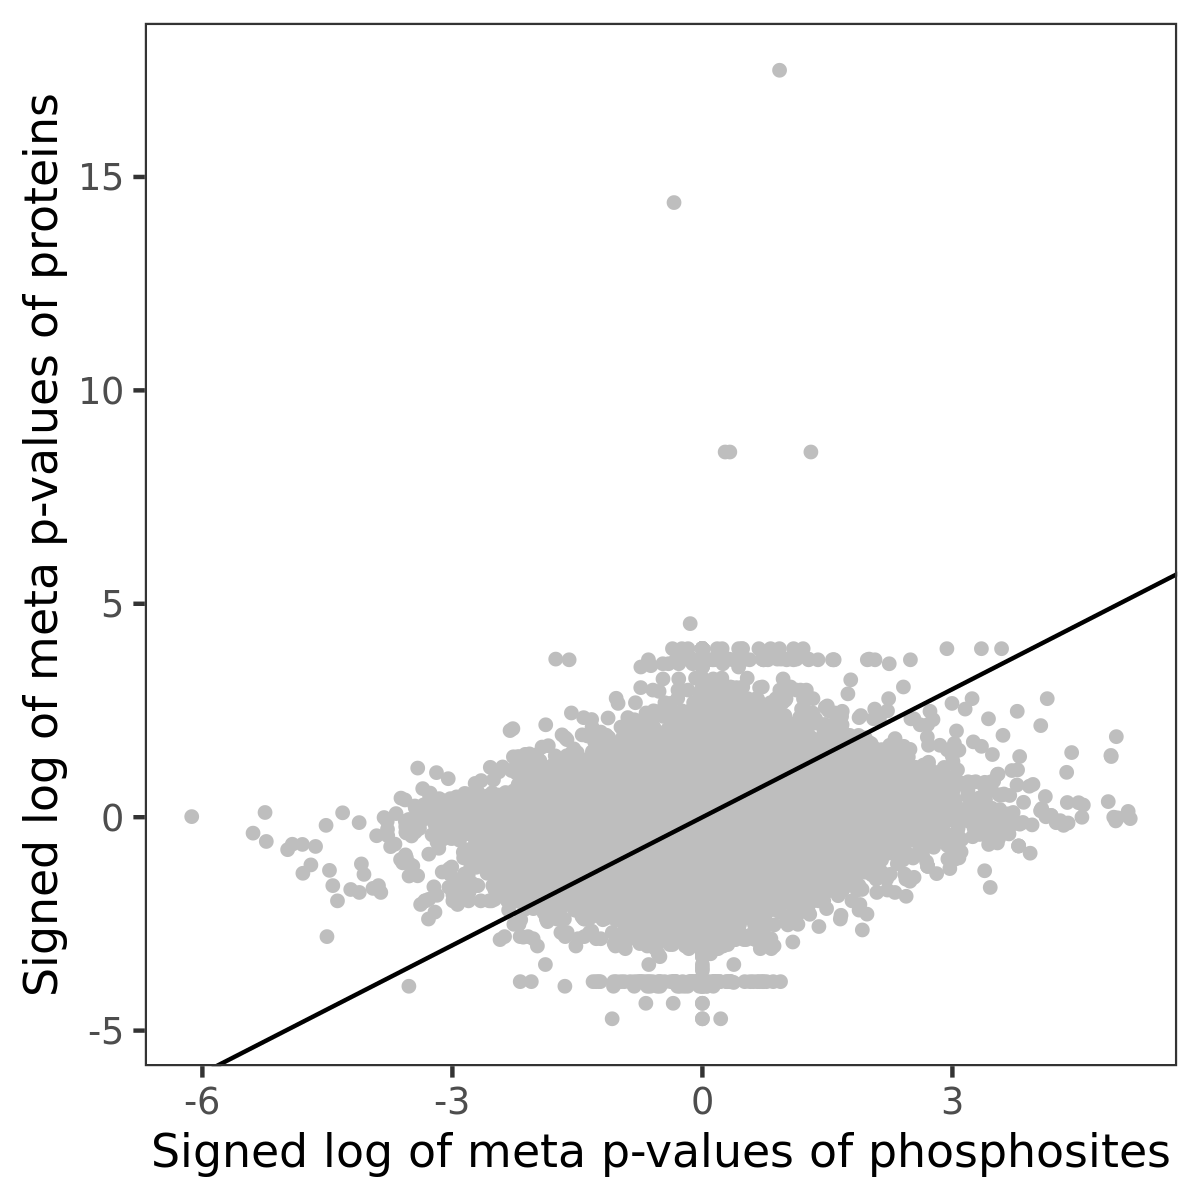
Phosphosite association
Number of significant genes with P-value ≤ 10-6 for each cohorts are summarized in the bar plot. The scatter plot highlights significant associations diven by phosphorylation rather than protein abundance.
| Signed p-values | |||||||||||||
|---|---|---|---|---|---|---|---|---|---|---|---|---|---|
| Gene | Protein | Site | Meta P | BRCA | CCRCC | COAD | GBM | HNSCC | LSCC | LUAD | OV | PDAC | UCEC |
Gene set enrichment analysis
Submit phosphorylation sites and the common logarithm of the p-values of their association with cibersort: Eosinophil to WebGestalt.