Basic information
- Phenotype
- xcell: Monocyte
- Description
- Enrichment score inferring the proportion of monocytes in the tumor derived from RNA data using the xCell tool.
- Source
- https://genomebiology.biomedcentral.com/articles/10.1186/s13059-017-1349-1
- Method
- The R package immunedeconv (V2.0.4) (PMID: 31510660) was used to perform immune cell deconvolution using RNA expression data (TPM).
- Genes
-
- ABCB7
- ACAP2
- ADIPOR1
- AGFG1
- AHNAK
- AIF1
- AKAP13
- AKAP8
- ANKS1A
- ANXA1
- AP1G1
- APAF1
- APBB3
- ARF5
- ARL8B
- ARNT
- ASGR2
- ATG3
- ATP6V0D1
- AZIN1
- BCL10
- BCL2L11
- BEST1
- BNIP2
- BPI
- BTAF1
- BTK
- C3AR1
- CALCOCO2
- CAMKK2
- CAPN2
- CAPN3
- CAPNS1
- CARS2
- CASP5
- CAST
- CBX6
- CCR2
- CD101
- CD163
- CD1E
- CD244
- CD300C
- CD33
- CD4
- CD48
- CD93
- CDC40
- CDK9
- CEACAM4
- CEPT1
- CFP
- CLEC10A
- CLEC1A
- CLEC3B
- CLEC4A
- CLEC4E
- CLEC5A
- CLIP1
- COMMD9
- COQ2
- CSF1R
- CSF3R
- CSNK1A1
- CTBP2
- CUL5
- CX3CR1
- CXCR2
- CXorf21
- CYBB
- CYSLTR2
- DCTN4
- DDX21
- DDX3X
- DENND1A
- DHX57
- DHX8
- DLG4
- DNAH17
- DNAJC13
- DOK2
- DOK3
- DPEP2
- EIF1B
- EIF4E2
- ELL
- ETF1
- ETV3
- EWSR1
- F13A1
- FAM32A
- FBXL5
- FBXO11
- FCAR
- FCER1A
- FCER1G
- FCN1
- FGL2
- FGR
- FKBP15
- FNDC3A
- FOLR2
- FOLR3
- FPR2
- GABARAP
- GALNT3
- GGA1
- GIT2
- GNA13
- GNMT
- GPR162
- GPR183
- GRPEL1
- HADHA
- HCK
- HIC1
- HIF1A
- HIPK1
- HK3
- HNRNPU
- HRH2
- HSPA6
- HUS1
- IL10RA
- IL17RA
- IMPDH1
- IQGAP1
- IQSEC2
- JMJD1C
- JMJD6
- KCNC3
- KCNMB1
- KDM6B
- KLHL18
- KSR1
- LILRA1
- LILRA2
- LILRA5
- LILRB1
- LILRB2
- LILRB3
- LRRFIP1
- LST1
- LTBR
- LY86
- LYL1
- MAN2C1
- MAP2K1
- MAP3K11
- MAP3K2
- MAP3K3
- MAPK14
- MAPK6
- MARCO
- MARK3
- MBOAT7
- MED13L
- MEFV
- METTL9
- MIOS
- MMP17
- MNDA
- MNT
- MPHOSPH6
- MS4A4A
- MS4A6A
- MTF1
- MTHFR
- MTMR14
- MTMR3
- MYO1F
- NCF4
- NCOA4
- NDST2
- NEK4
- NKIRAS2
- NPLOC4
- NSFL1C
- NUBP1
- NUP214
- OGFR
- OSBPL11
- OSM
- P2RY13
- PADI4
- PANK2
- PCTP
- PDE6H
- PGGT1B
- PGLS
- PHKG2
- PHLDA2
- PIAS1
- PIKFYVE
- PILRA
- PLAA
- PLD2
- PLEK
- PLP2
- PNP
- POU2F2
- PPM1A
- PPM1F
- PPP1CB
- PRKACA
- PSTPIP1
- PTCH2
- PTEN
- PTGIR
- PTP4A2
- PTPN18
- QKI
- RAB5A
- RABGEF1
- RARA
- RBM41
- REEP4
- RELA
- RETN
- RGS19
- RHOA
- RHOG
- RHOT1
- RIN2
- RIOK3
- RLIM
- RNASE2
- RPGRIP1
- RPH3A
- RPS6KC1
- RTN3
- S100A10
- S100A12
- S100A6
- SAMSN1
- SAR1A
- SEC11A
- SEMA6B
- SERP1
- SETX
- SH3BP2
- SIGLEC9
- SIK3
- SIN3B
- SLC11A1
- SLC38A10
- SNX17
- SOCS3
- SPEN
- SPG11
- SRC
- STAB1
- STRN4
- STX12
- STX5
- SUN1
- SUPT6H
- TBK1
- TGOLN2
- TLR7
- TLR8
- TMBIM4
- TMEM104
- TMEM11
- TMEM127
- TMEM9B
- TNFRSF8
- TPD52L2
- TREM1
- TREX1
- TSEN34
- TSPO
- TTLL4
- TYROBP
- UBE2D1
- UBR2
- UBXN2B
- UPK3A
- USP15
- USP4
- USP48
- USP8
- VASP
- VENTX
- VNN3
- WAS
- WDR11
- WTAP
- WWP2
- YTHDF3
- ZBTB7A
- ZDHHC3
- ZFC3H1
- ZMYM4
- ZNF668
- ZNF710
- ZNF787
- More...
Gene association
Number of significant genes with P-value ≤ 10-6 for each cohorts are summarized in bar plots. The scatter plot highlights significant associations diven by protein rather than mRNA abundance.
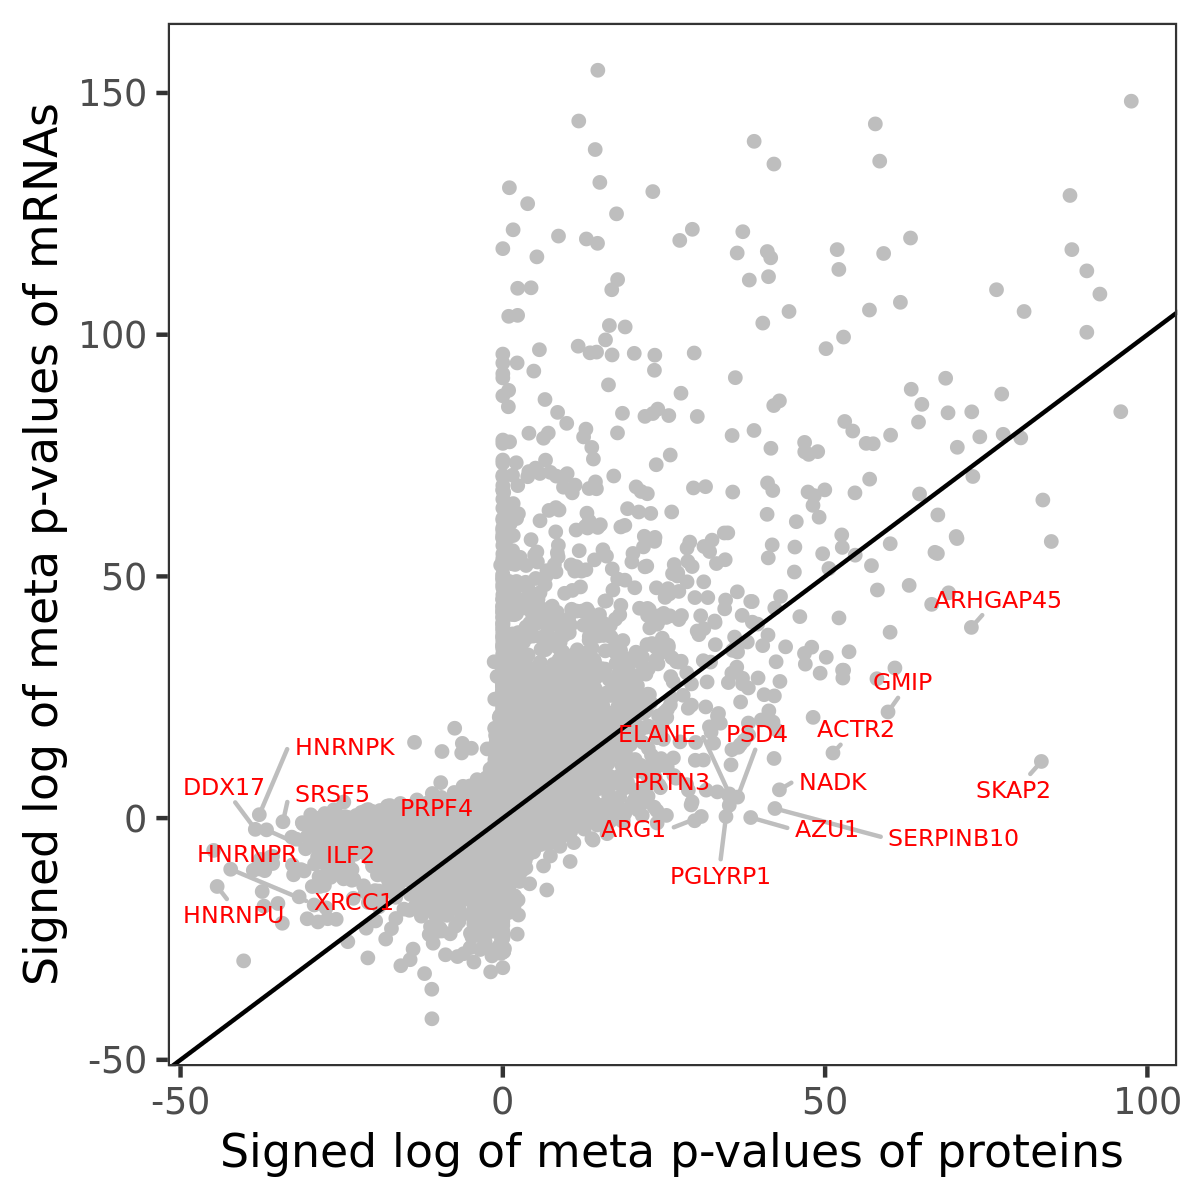
Association of protein abundance of genes
| Signed p-values | |||||||||||
|---|---|---|---|---|---|---|---|---|---|---|---|
| Gene | Meta P | BRCA | CCRCC | COAD | GBM | HNSCC | LSCC | LUAD | OV | PDAC | UCEC |
Gene set enrichment analysis
Submit genes and the common logarithm of the p-values of their association with xcell: Monocyte to WebGestalt.
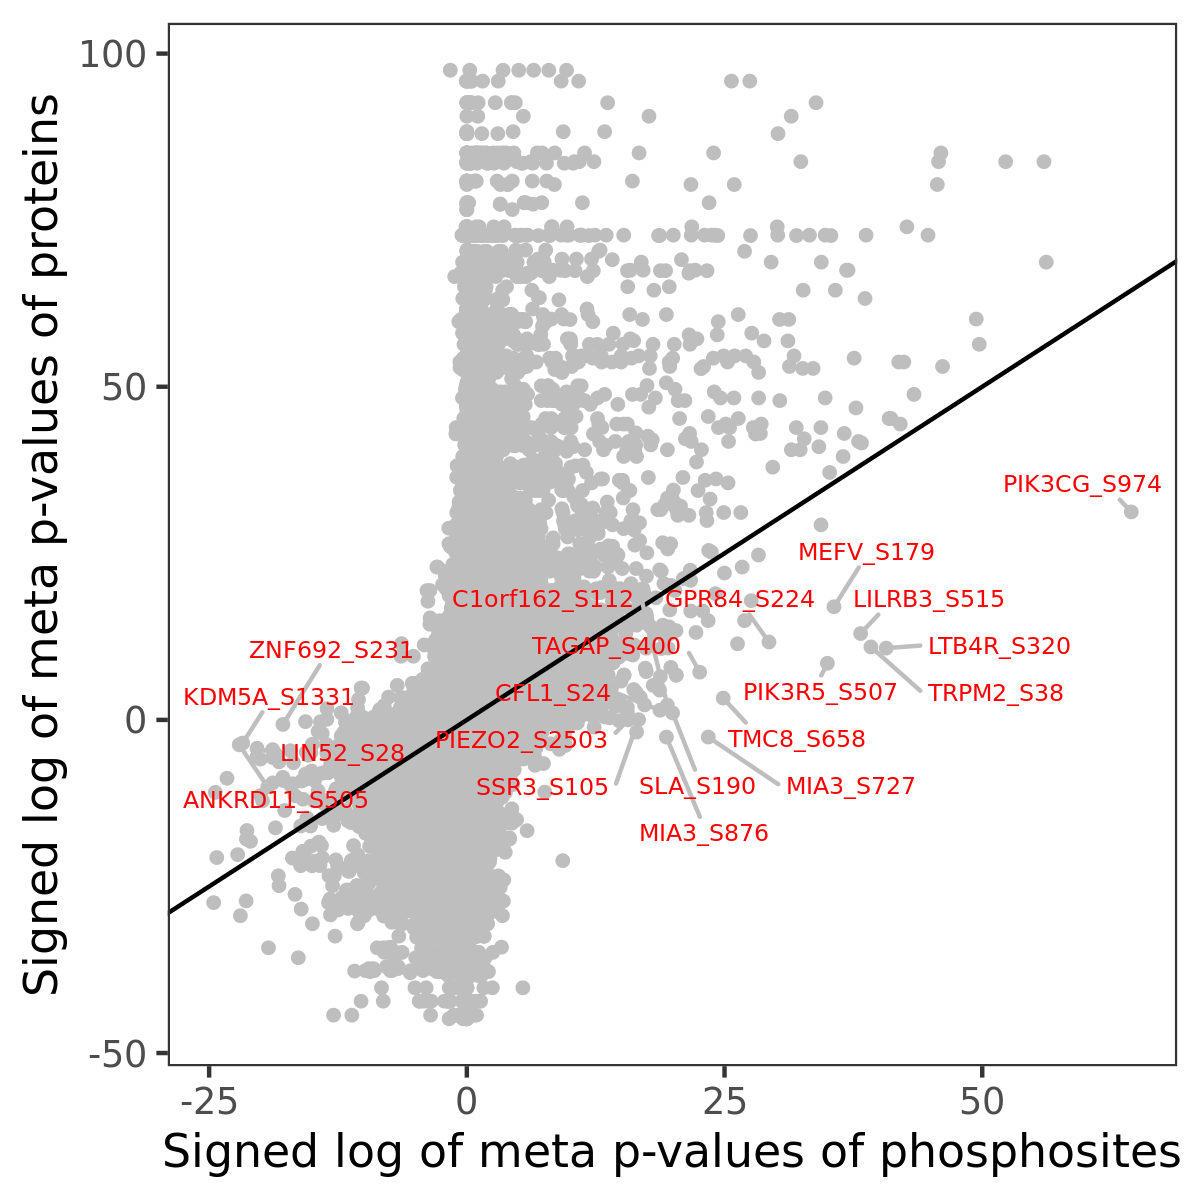
Phosphosite association
Number of significant genes with P-value ≤ 10-6 for each cohorts are summarized in the bar plot. The scatter plot highlights significant associations diven by phosphorylation rather than protein abundance.
| Signed p-values | |||||||||||||
|---|---|---|---|---|---|---|---|---|---|---|---|---|---|
| Gene | Protein | Site | Meta P | BRCA | CCRCC | COAD | GBM | HNSCC | LSCC | LUAD | OV | PDAC | UCEC |
Gene set enrichment analysis
Submit phosphorylation sites and the common logarithm of the p-values of their association with xcell: Monocyte to WebGestalt.