Basic information
- Phenotype
- HALLMARK_E2F_TARGETS
- Description
- Enrichment score representing the targets of the E2F transcription factor. The score was calculated using ssGSEA on the RNA data (Z-score transformed coding genes with expression in at least 50% of the samples in a cohort).
- Source
- http://www.gsea-msigdb.org/gsea/msigdb/cards/HALLMARK_E2F_TARGETS.html
- Method
- Single sample gene set enrichment analysis (ssGSEA) was performed for each cancer type using gene-wise Z-scores of the RNA expression data (RSEM) for the MSigDB Hallmark gene sets v7.0 (PMID: 26771021) via the ssGSEA2.0 R package (PMID: 30563849). RNA data were filtered to coding genes with < 50% 0 expression. (Parameters: sample.norm.type="rank", weight=0.75, statistic="area.under.RES", nperm=1000, min.overlap=10). Pathway activity scores are normalized enrichment scores from ssGSEA.
- Genes
-
- ANP32E
- ASF1A
- ASF1B
- ATAD2
- AURKA
- AURKB
- BARD1
- BIRC5
- BRCA1
- BRCA2
- BRMS1L
- BUB1B
- CBX5
- CCNB2
- CCNE1
- CCP110
- CDC20
- CDC25A
- CDC25B
- CDCA3
- CDCA8
- CDK1
- CDK4
- CDKN1A
- CDKN1B
- CDKN2A
- CDKN2C
- CDKN3
- CENPE
- CENPM
- CHEK1
- CHEK2
- CIT
- CKS1B
- CKS2
- CNOT9
- CSE1L
- CTCF
- CTPS1
- DCK
- DCLRE1B
- DCTPP1
- DDX39A
- DEK
- DEPDC1
- DIAPH3
- DLGAP5
- DNMT1
- DONSON
- DSCC1
- DUT
- E2F8
- EED
- EIF2S1
- ESPL1
- EXOSC8
- EZH2
- GINS1
- GINS3
- GINS4
- GSPT1
- H2AX
- H2AZ1
- HELLS
- HMGA1
- HMGB2
- HMGB3
- HMMR
- HNRNPD
- HUS1
- ILF3
- ING3
- IPO7
- JPT1
- KIF18B
- KIF22
- KIF2C
- KIF4A
- KPNA2
- LBR
- LIG1
- LMNB1
- LUC7L3
- LYAR
- MAD2L1
- MCM2
- MCM3
- MCM4
- MCM5
- MCM6
- MCM7
- MELK
- MKI67
- MLH1
- MMS22L
- MRE11
- MSH2
- MTHFD2
- MXD3
- MYBL2
- MYC
- NAA38
- NAP1L1
- NASP
- NBN
- NCAPD2
- NME1
- NOLC1
- NOP56
- NUDT21
- NUP107
- NUP153
- NUP205
- ORC2
- ORC6
- PA2G4
- PAICS
- PAN2
- PCNA
- PDS5B
- PHF5A
- PLK1
- PLK4
- PMS2
- PNN
- POLA2
- POLD1
- POLD2
- POLD3
- POLE
- POLE4
- POP7
- PPM1D
- PPP1R8
- PRDX4
- PRIM2
- PRKDC
- PRPS1
- PSIP1
- PSMC3IP
- PTTG1
- RACGAP1
- RAD1
- RAD21
- RAD50
- RAD51AP1
- RAD51C
- RAN
- RANBP1
- RBBP7
- RFC1
- RFC2
- RFC3
- RNASEH2A
- RPA1
- RPA2
- RPA3
- RRM2
- SHMT1
- SLBP
- SMC1A
- SMC3
- SMC4
- SMC6
- SNRPB
- SPAG5
- SPC24
- SPC25
- SRSF1
- SRSF2
- SSRP1
- STAG1
- STMN1
- SUV39H1
- SYNCRIP
- TACC3
- TBRG4
- TCF19
- TFRC
- TIMELESS
- TIPIN
- TK1
- TMPO
- TOP2A
- TP53
- TRA2B
- TRIP13
- TUBB
- TUBG1
- UBE2S
- UBE2T
- UBR7
- UNG
- USP1
- WDR90
- WEE1
- XPO1
- XRCC6
- ZW10
- More...
Gene association
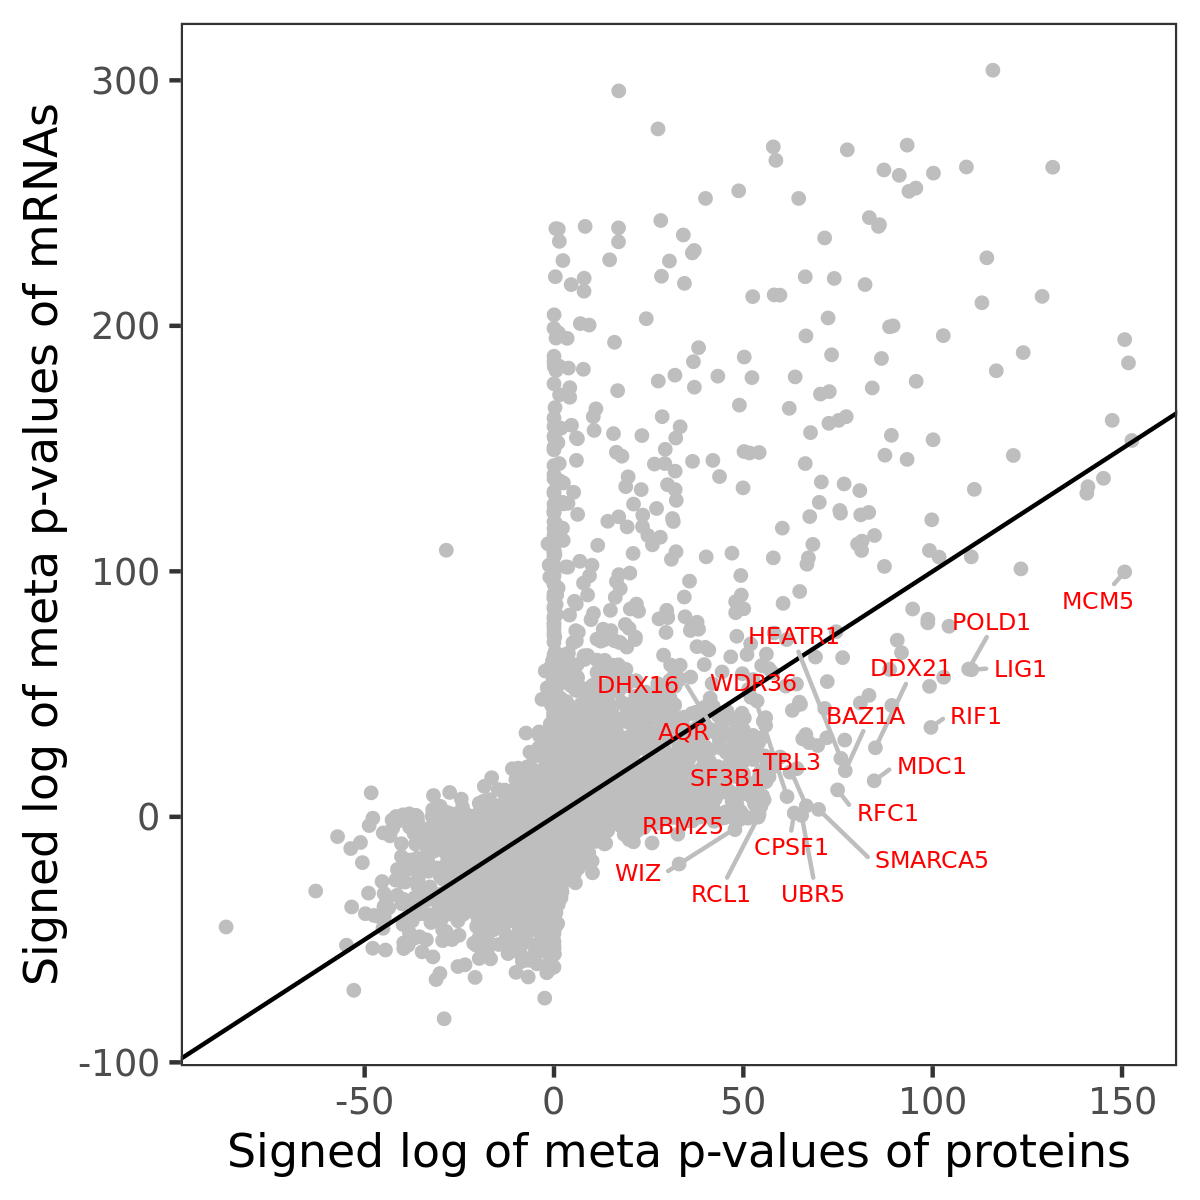
Number of significant genes with P-value ≤ 10-6 for each cohorts are summarized in bar plots. The scatter plot highlights significant associations diven by protein rather than mRNA abundance.

Association of protein abundance of genes
Signed p-values | ||||||||||||
|---|---|---|---|---|---|---|---|---|---|---|---|---|
Gene | Meta P | BRCA | CCRCC | COAD | GBM | HNSCC | LSCC | LUAD | OV | PDAC | UCEC | |
| No matching records found | ||||||||||||
Gene set enrichment analysis
Submit genes and the common logarithm of the p-values of their association with HALLMARK_E2F_TARGETS to WebGestalt.
Phosphosite association
Number of significant genes with P-value ≤ 10-6 for each cohorts are summarized in the bar plot. The scatter plot highlights significant associations diven by phosphorylation rather than protein abundance.

Signed p-values | |||||||||||||
|---|---|---|---|---|---|---|---|---|---|---|---|---|---|
Gene | Protein | Site | Meta P | BRCA | CCRCC | COAD | GBM | HNSCC | LSCC | LUAD | OV | PDAC | UCEC |
| No matching records found | |||||||||||||
Gene set enrichment analysis
Submit phosphorylation sites and the common logarithm of the p-values of their association with HALLMARK_E2F_TARGETS to WebGestalt.