Basic information
- Phenotype
- HALLMARK_ESTROGEN_RESPONSE_EARLY
- Description
- Enrichment score representing the early estrogen response. The score was calculated using ssGSEA on the RNA data (Z-score transformed coding genes with expression in at least 50% of the samples in a cohort).
- Source
- http://www.gsea-msigdb.org/gsea/msigdb/cards/HALLMARK_ESTROGEN_RESPONSE_EARLY.html
- Method
- Single sample gene set enrichment analysis (ssGSEA) was performed for each cancer type using gene-wise Z-scores of the RNA expression data (RSEM) for the MSigDB Hallmark gene sets v7.0 (PMID: 26771021) via the ssGSEA2.0 R package (PMID: 30563849). RNA data were filtered to coding genes with < 50% 0 expression. (Parameters: sample.norm.type="rank", weight=0.75, statistic="area.under.RES", nperm=1000, min.overlap=10). Pathway activity scores are normalized enrichment scores from ssGSEA.
- Genes
-
- ABCA3
- ABHD2
- ABLIM1
- ADCY1
- ADCY9
- ADD3
- AFF1
- AKAP1
- ALDH3B1
- AMFR
- ANXA9
- AQP3
- AR
- AREG
- ARL3
- ASB13
- B4GALT1
- BAG1
- BCL11B
- BCL2
- BHLHE40
- BLVRB
- CA12
- CALB2
- CALCR
- CANT1
- CBFA2T3
- CCN5
- CCND1
- CD44
- CELSR1
- CELSR2
- CHPT1
- CISH
- CLDN7
- CLIC3
- CXCL12
- CYP26B1
- DEPTOR
- DHCR7
- DHRS2
- DHRS3
- DLC1
- DYNLT3
- EGR3
- ELF1
- ELF3
- ELOVL2
- ELOVL5
- ENDOD1
- ESRP2
- FAM102A
- FARP1
- FASN
- FCMR
- FDFT1
- FHL2
- FKBP4
- FKBP5
- FLNB
- FOS
- FOXC1
- FRK
- GAB2
- GFRA1
- GJA1
- GLA
- GREB1
- HES1
- HR
- HSPB8
- IGF1R
- IGFBP4
- IL17RB
- IL6ST
- INHBB
- INPP5F
- ISG20L2
- ITPK1
- JAK2
- KAZN
- KCNK15
- KCNK5
- KDM4B
- KLF10
- KLF4
- KLK10
- KRT13
- KRT15
- KRT18
- KRT19
- KRT8
- LAD1
- LRIG1
- MAPT
- MAST4
- MED13L
- MED24
- MICB
- MINDY1
- MLPH
- MPPED2
- MREG
- MSMB
- MUC1
- MYB
- MYBBP1A
- MYBL1
- MYC
- MYOF
- NADSYN1
- NAV2
- NBL1
- NCOR2
- NPY1R
- NRIP1
- NXT1
- OLFM1
- OLFML3
- OPN3
- OVOL2
- P2RY2
- PAPSS2
- PDLIM3
- PDZK1
- PEX11A
- PGR
- PLAAT3
- PMAIP1
- PODXL
- PPIF
- PRSS23
- PTGES
- RAB17
- RAB31
- RAPGEFL1
- RARA
- RASGRP1
- RBBP8
- REEP1
- RET
- RETREG1
- RHOBTB3
- RHOD
- RPS6KA2
- RRP12
- SCARB1
- SCNN1A
- SEC14L2
- SEMA3B
- SFN
- SH3BP5
- SIAH2
- SLC16A1
- SLC19A2
- SLC1A1
- SLC1A4
- SLC22A5
- SLC24A3
- SLC26A2
- SLC27A2
- SLC2A1
- SLC37A1
- SLC39A6
- SLC7A2
- SLC7A5
- SLC9A3R1
- SNX24
- SOX3
- STC2
- SULT2B1
- SVIL
- SYBU
- SYNGR1
- SYT12
- TBC1D30
- TFAP2C
- TFF1
- TFF3
- TGIF2
- TGM2
- THSD4
- TIAM1
- TIPARP
- TJP3
- TMEM164
- TMPRSS3
- TOB1
- TPBG
- TPD52L1
- TSKU
- TTC39A
- TUBB2B
- UGCG
- UNC119
- WFS1
- WWC1
- XBP1
- ZNF185
- More...
Gene association
Number of significant genes with P-value ≤ 10-6 for each cohorts are summarized in bar plots. The scatter plot highlights significant associations diven by protein rather than mRNA abundance.
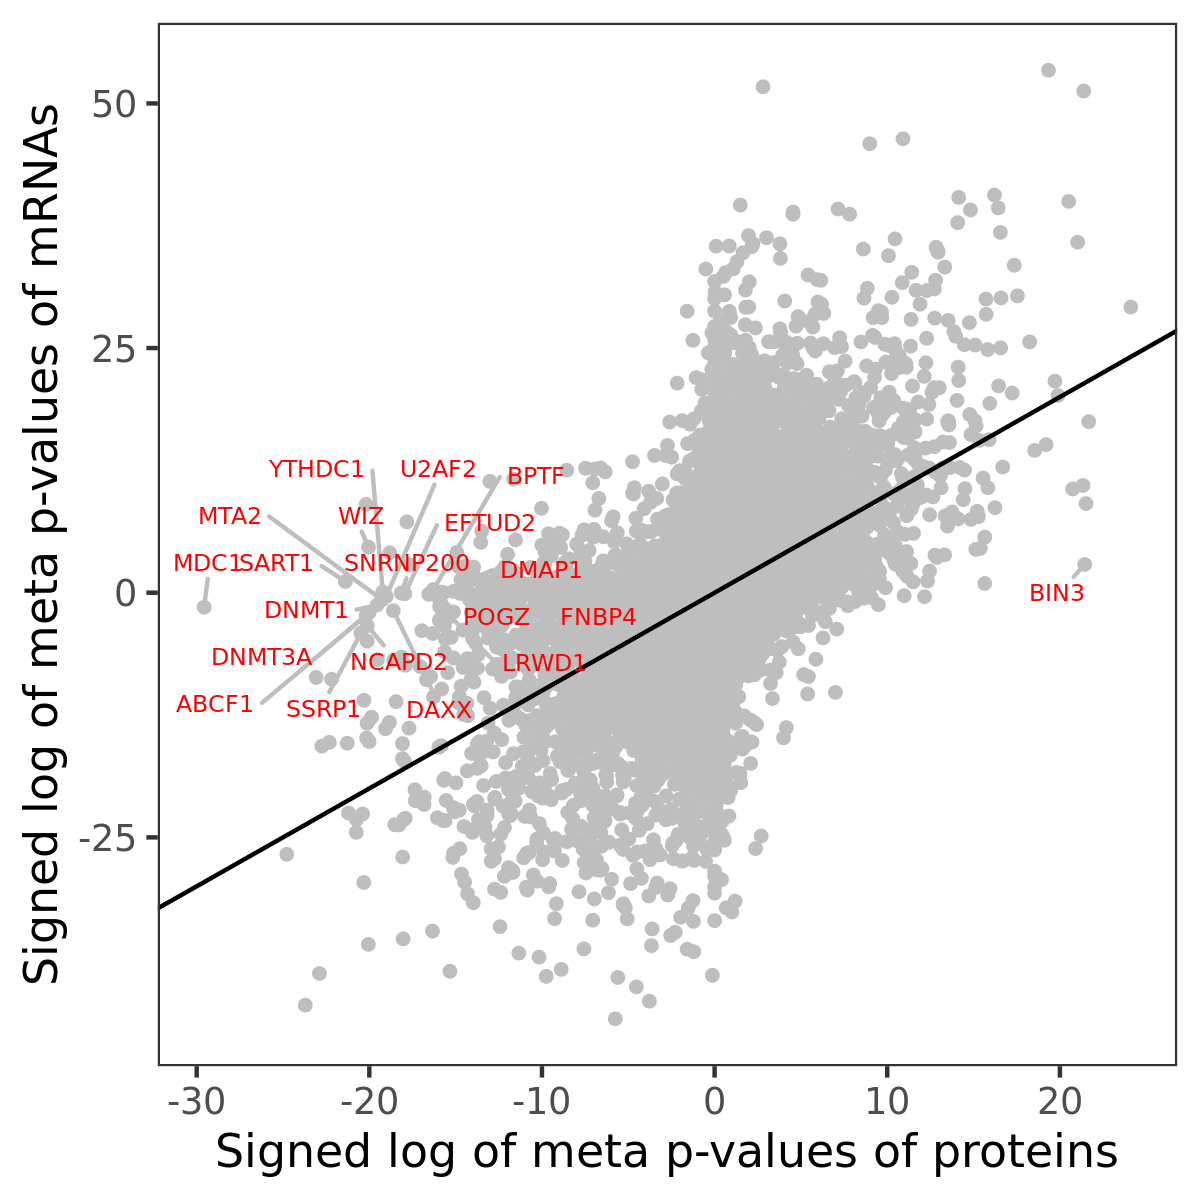
Association of protein abundance of genes
| Signed p-values | |||||||||||
|---|---|---|---|---|---|---|---|---|---|---|---|
| Gene | Meta P | BRCA | CCRCC | COAD | GBM | HNSCC | LSCC | LUAD | OV | PDAC | UCEC |
Gene set enrichment analysis
Submit genes and the common logarithm of the p-values of their association with HALLMARK_ESTROGEN_RESPONSE_EARLY to WebGestalt.
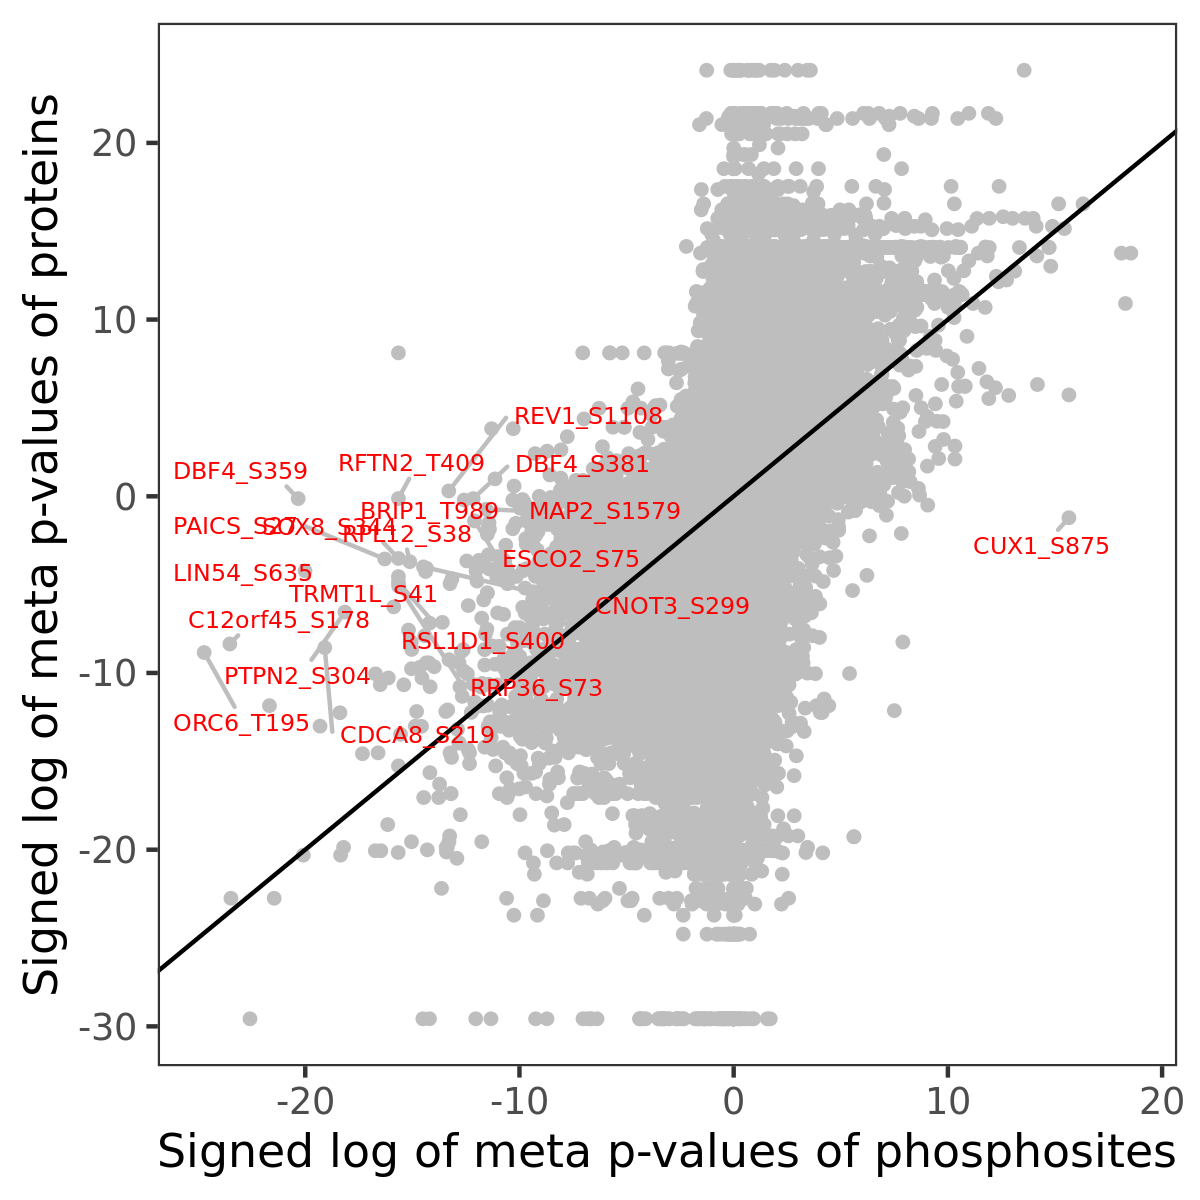
Phosphosite association
Number of significant genes with P-value ≤ 10-6 for each cohorts are summarized in the bar plot. The scatter plot highlights significant associations diven by phosphorylation rather than protein abundance.
| Signed p-values | |||||||||||||
|---|---|---|---|---|---|---|---|---|---|---|---|---|---|
| Gene | Protein | Site | Meta P | BRCA | CCRCC | COAD | GBM | HNSCC | LSCC | LUAD | OV | PDAC | UCEC |
Gene set enrichment analysis
Submit phosphorylation sites and the common logarithm of the p-values of their association with HALLMARK_ESTROGEN_RESPONSE_EARLY to WebGestalt.