Basic information
- Phenotype
- HALLMARK_G2M_CHECKPOINT
- Description
- Enrichment score representing genes involved in the G2M checkpoint. The score was calculated using ssGSEA on the RNA data (Z-score transformed coding genes with expression in at least 50% of the samples in a cohort).
- Source
- http://www.gsea-msigdb.org/gsea/msigdb/cards/HALLMARK_G2M_CHECKPOINT.html
- Method
- Single sample gene set enrichment analysis (ssGSEA) was performed for each cancer type using gene-wise Z-scores of the RNA expression data (RSEM) for the MSigDB Hallmark gene sets v7.0 (PMID: 26771021) via the ssGSEA2.0 R package (PMID: 30563849). RNA data were filtered to coding genes with < 50% 0 expression. (Parameters: sample.norm.type="rank", weight=0.75, statistic="area.under.RES", nperm=1000, min.overlap=10). Pathway activity scores are normalized enrichment scores from ssGSEA.
- Genes
-
- AMD1
- ARID4A
- ATF5
- ATRX
- AURKA
- AURKB
- BARD1
- BCL3
- BIRC5
- BRCA2
- BUB1
- BUB3
- CASP8AP2
- CBX1
- CCNA2
- Array
- CCNB2
- CCND1
- CCNF
- CCNT1
- CDC20
- CDC25A
- CDC25B
- CDC27
- CDC45
- CDC6
- CDC7
- CDK1
- CDK4
- CDKN1B
- CDKN2C
- CDKN3
- CENPA
- CENPE
- CENPF
- CHAF1A
- CHEK1
- CHMP1A
- CKS1B
- Array
- CKS2
- CTCF
- CUL1
- CUL3
- CUL4A
- CUL5
- DBF4
- DDX39A
- DKC1
- DMD
- DR1
- DTYMK
- E2F1
- E2F2
- E2F3
- E2F4
- EFNA5
- EGF
- ESPL1
- EWSR1
- EXO1
- EZH2
- FANCC
- FBXO5
- FOXN3
- G3BP1
- GINS2
- GSPT1
- H2AX
- H2AZ1
- H2AZ2
- H2BC12
- HIF1A
- HIRA
- HMGA1
- HMGB3
- HMGN2
- HMMR
- HNRNPD
- HNRNPU
- HOXC10
- HSPA8
- HUS1
- ILF3
- INCENP
- JPT1
- KATNA1
- KIF11
- KIF15
- KIF20B
- KIF22
- KIF2C
- KIF4A
- KIF5B
- KMT5A
- KNL1
- KPNA2
- KPNB1
- LBR
- LIG3
- LMNB1
- MAD2L1
- MAP3K20
- MAPK14
- MARCKS
- MCM2
- MCM3
- MCM5
- MCM6
- MEIS1
- MEIS2
- MKI67
- MNAT1
- MT2A
- MTF2
- MYBL2
- MYC
- NASP
- NCL
- NDC80
- NEK2
- NOLC1
- NOTCH2
- NSD2
- NUMA1
- NUP50
- NUP98
- NUSAP1
- ODC1
- ODF2
- ORC5
- ORC6
- PAFAH1B1
- PBK
- PDS5B
- PLK1
- PLK4
- PML
- POLA2
- POLE
- POLQ
- PRC1
- PRIM2
- PRMT5
- PRPF4B
- PTTG1
- PURA
- RACGAP1
- RAD21
- RAD23B
- RAD54L
- RASAL2
- RBL1
- RBM14
- RPA2
- RPS6KA5
- SAP30
- SFPQ
- SLC12A2
- SLC38A1
- SLC7A1
- SLC7A5
- SMAD3
- SMARCC1
- SMC1A
- SMC2
- SMC4
- SNRPD1
- SQLE
- SRSF1
- SRSF10
- SRSF2
- STAG1
- STIL
- STMN1
- SUV39H1
- SYNCRIP
- TACC3
- TENT4A
- TFDP1
- TGFB1
- TLE3
- TMPO
- TNPO2
- TOP1
- TOP2A
- TPX2
- TRA2B
- TRAIP
- TROAP
- TTK
- UBE2C
- UBE2S
- UCK2
- UPF1
- WRN
- XPO1
- YTHDC1
- More...
Gene association
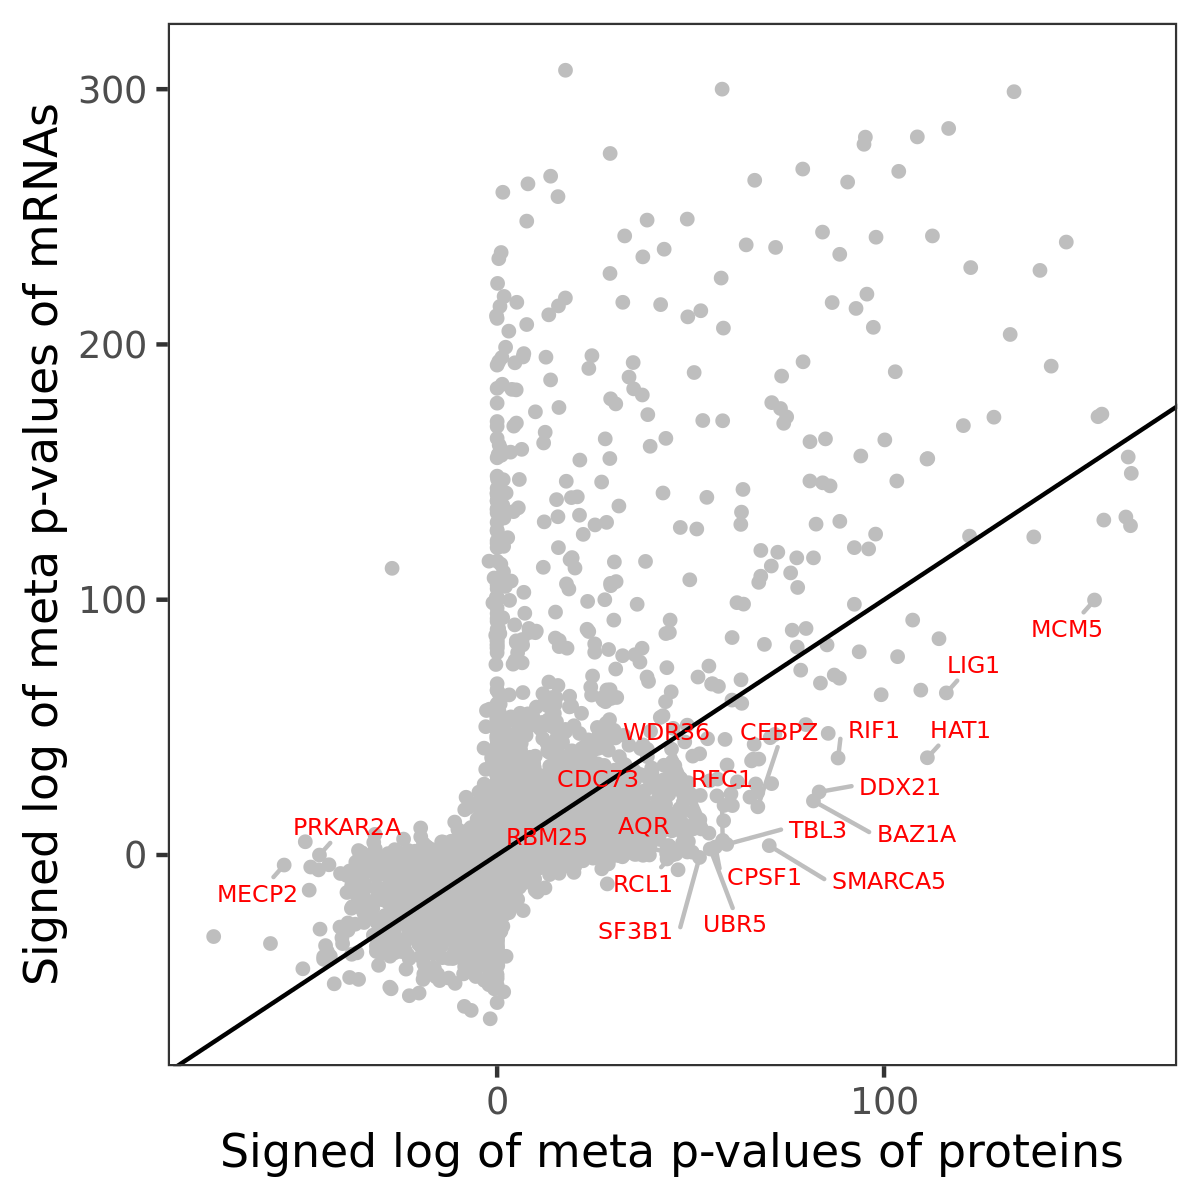
Number of significant genes with P-value ≤ 10-6 for each cohorts are summarized in bar plots. The scatter plot highlights significant associations diven by protein rather than mRNA abundance.

Association of protein abundance of genes
| Signed p-values | |||||||||||
|---|---|---|---|---|---|---|---|---|---|---|---|
| Gene | Meta P | BRCA | CCRCC | COAD | GBM | HNSCC | LSCC | LUAD | OV | PDAC | UCEC |
Gene set enrichment analysis
Submit genes and the common logarithm of the p-values of their association with HALLMARK_G2M_CHECKPOINT to WebGestalt.
Phosphosite association
Number of significant genes with P-value ≤ 10-6 for each cohorts are summarized in the bar plot. The scatter plot highlights significant associations diven by phosphorylation rather than protein abundance.

| Signed p-values | |||||||||||||
|---|---|---|---|---|---|---|---|---|---|---|---|---|---|
| Gene | Protein | Site | Meta P | BRCA | CCRCC | COAD | GBM | HNSCC | LSCC | LUAD | OV | PDAC | UCEC |
Gene set enrichment analysis
Submit phosphorylation sites and the common logarithm of the p-values of their association with HALLMARK_G2M_CHECKPOINT to WebGestalt.