Basic information
- Phenotype
- HALLMARK_MYC_TARGETS_V1
- Description
- Enrichment score representing targets regulated by MYC (version 1). The score was calculated using ssGSEA on the RNA data (Z-score transformed coding genes with expression in at least 50% of the samples in a cohort).
- Source
- http://www.gsea-msigdb.org/gsea/msigdb/cards/HALLMARK_MYC_TARGETS_V1.html
- Method
- Single sample gene set enrichment analysis (ssGSEA) was performed for each cancer type using gene-wise Z-scores of the RNA expression data (RSEM) for the MSigDB Hallmark gene sets v7.0 (PMID: 26771021) via the ssGSEA2.0 R package (PMID: 30563849). RNA data were filtered to coding genes with < 50% 0 expression. (Parameters: sample.norm.type="rank", weight=0.75, statistic="area.under.RES", nperm=1000, min.overlap=10). Pathway activity scores are normalized enrichment scores from ssGSEA.
- Genes
-
- ACP1
- AIMP2
- AP3S1
- APEX1
- BUB3
- C1QBP
- CAD
- CANX
- CBX3
- CCNA2
- CCT2
- CCT3
- CCT4
- CCT5
- CCT7
- CDC20
- CDC45
- CDK2
- CDK4
- CLNS1A
- CNBP
- COPS5
- COX5A
- CSTF2
- CTPS1
- CUL1
- CYC1
- DDX18
- DDX21
- DEK
- DHX15
- DUT
- EEF1B2
- EIF1AX
- EIF2S1
- EIF2S2
- EIF3B
- EIF3D
- EIF3J
- EIF4A1
- EIF4E
- EIF4G2
- EIF4H
- EPRS1
- ERH
- ETF1
- EXOSC7
- FAM120A
- FBL
- G3BP1
- GLO1
- GNL3
- GOT2
- GSPT1
- H2AZ1
- HDAC2
- HDDC2
- HDGF
- HNRNPA1
- HNRNPA2B1
- HNRNPA3
- HNRNPC
- HNRNPD
- HNRNPR
- HNRNPU
- HPRT1
- HSP90AB1
- HSPD1
- HSPE1
- IARS1
- IFRD1
- ILF2
- IMPDH2
- KARS1
- KPNA2
- KPNB1
- LDHA
- LSM2
- LSM7
- MAD2L1
- MCM2
- MCM4
- MCM5
- MCM6
- MCM7
- MRPL23
- MRPL9
- MRPS18B
- MYC
- NAP1L1
- NCBP1
- NCBP2
- NDUFAB1
- NHP2
- NME1
- NOLC1
- NOP16
- NOP56
- NPM1
- ODC1
- ORC2
- PA2G4
- PABPC1
- PABPC4
- PCBP1
- PCNA
- PGK1
- PHB
- PHB2
- POLD2
- POLE3
- PPIA
- PPM1G
- PRDX3
- PRDX4
- PRPF31
- PRPS2
- PSMA1
- PSMA2
- PSMA4
- PSMA6
- PSMA7
- PSMB2
- PSMB3
- PSMC4
- PSMC6
- PSMD1
- PSMD14
- PSMD3
- PSMD7
- PSMD8
- PTGES3
- PWP1
- RACK1
- RAD23B
- RAN
- RANBP1
- RFC4
- RNPS1
- RPL14
- RPL18
- RPL22
- RPL34
- RPL6
- RPLP0
- RPS10
- RPS2
- RPS3
- RPS5
- RPS6
- RRM1
- RRP9
- RSL1D1
- RUVBL2
- SERBP1
- SET
- SF3A1
- SF3B3
- SLC25A3
- SMARCC1
- SNRPA
- SNRPA1
- SNRPB2
- SNRPD1
- SNRPD2
- SNRPD3
- SNRPG
- SRM
- SRPK1
- SRSF1
- SRSF2
- SRSF3
- SRSF7
- SSB
- SSBP1
- STARD7
- SYNCRIP
- TARDBP
- TCP1
- TFDP1
- TOMM70
- TRA2B
- TRIM28
- TUFM
- TXNL4A
- TYMS
- U2AF1
- UBA2
- UBE2E1
- UBE2L3
- USP1
- VBP1
- VDAC1
- VDAC3
- XPO1
- XPOT
- XRCC6
- YWHAE
- YWHAQ
- More...
Gene association
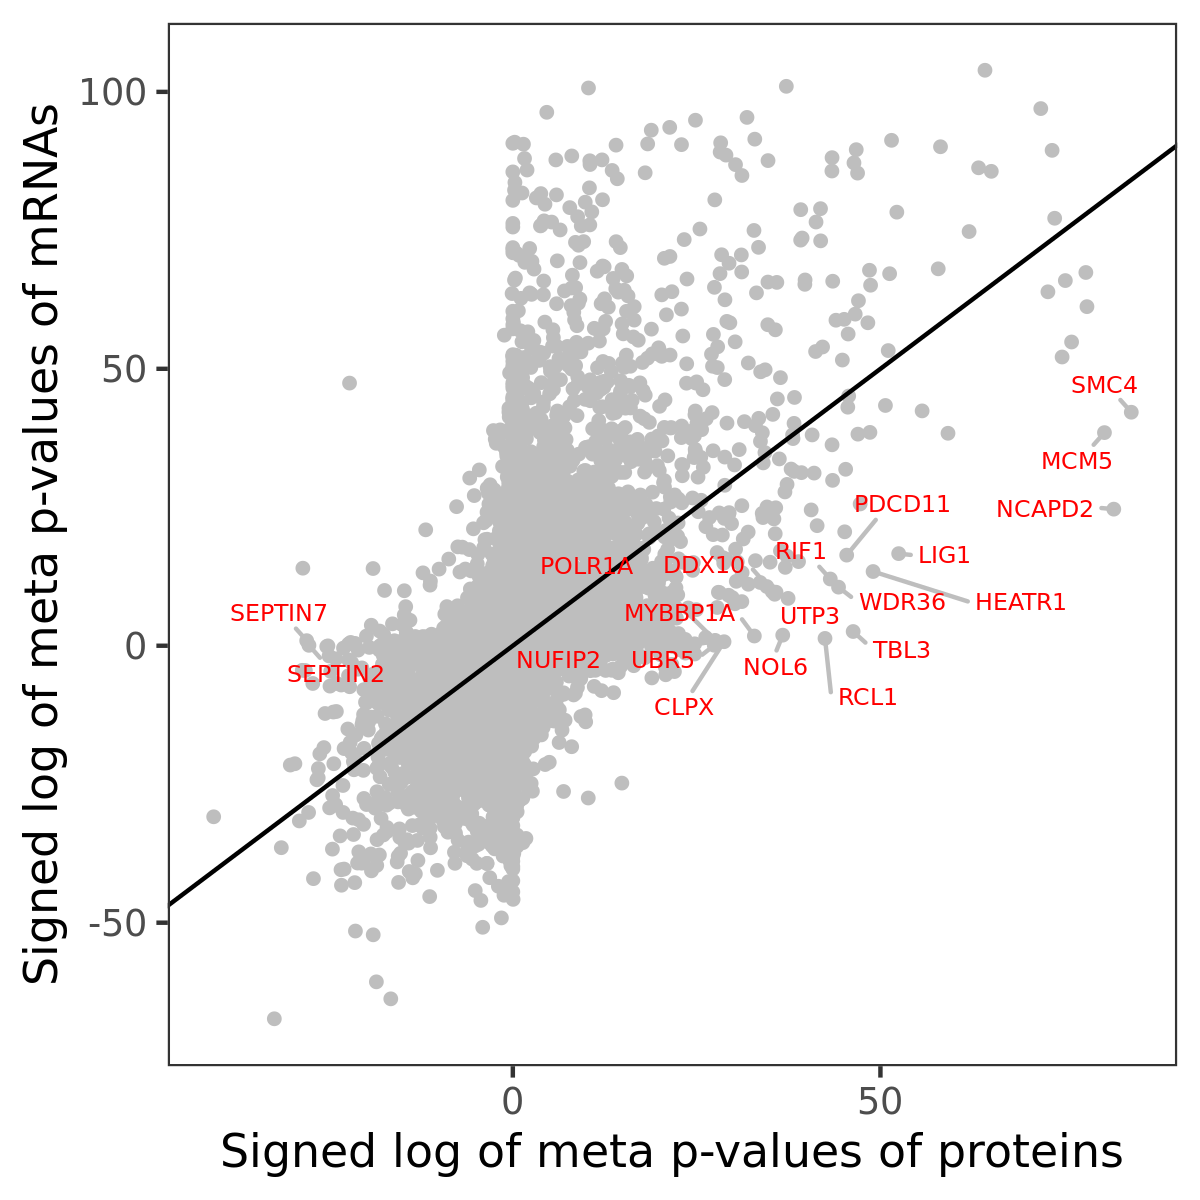
Number of significant genes with P-value ≤ 10-6 for each cohorts are summarized in bar plots. The scatter plot highlights significant associations diven by protein rather than mRNA abundance.

Association of protein abundance of genes
| Signed p-values | |||||||||||
|---|---|---|---|---|---|---|---|---|---|---|---|
| Gene | Meta P | BRCA | CCRCC | COAD | GBM | HNSCC | LSCC | LUAD | OV | PDAC | UCEC |
Gene set enrichment analysis
Submit genes and the common logarithm of the p-values of their association with HALLMARK_MYC_TARGETS_V1 to WebGestalt.
Phosphosite association
Number of significant genes with P-value ≤ 10-6 for each cohorts are summarized in the bar plot. The scatter plot highlights significant associations diven by phosphorylation rather than protein abundance.

| Signed p-values | |||||||||||||
|---|---|---|---|---|---|---|---|---|---|---|---|---|---|
| Gene | Protein | Site | Meta P | BRCA | CCRCC | COAD | GBM | HNSCC | LSCC | LUAD | OV | PDAC | UCEC |
Gene set enrichment analysis
Submit phosphorylation sites and the common logarithm of the p-values of their association with HALLMARK_MYC_TARGETS_V1 to WebGestalt.