Basic information
- Phenotype
- HALLMARK_MYOGENESIS
- Description
- Enrichment score representing genes involved in myogenesis. The score was calculated using ssGSEA on the RNA data (Z-score transformed coding genes with expression in at least 50% of the samples in a cohort).
- Source
- http://www.gsea-msigdb.org/gsea/msigdb/cards/HALLMARK_MYOGENESIS.html
- Method
- Single sample gene set enrichment analysis (ssGSEA) was performed for each cancer type using gene-wise Z-scores of the RNA expression data (RSEM) for the MSigDB Hallmark gene sets v7.0 (PMID: 26771021) via the ssGSEA2.0 R package (PMID: 30563849). RNA data were filtered to coding genes with < 50% 0 expression. (Parameters: sample.norm.type="rank", weight=0.75, statistic="area.under.RES", nperm=1000, min.overlap=10). Pathway activity scores are normalized enrichment scores from ssGSEA.
- Genes
-
- ACHE
- ACSL1
- ACTA1
- ACTC1
- ACTN2
- ACTN3
- ADAM12
- ADCY9
- AEBP1
- AGL
- AGRN
- AK1
- AKT2
- ANKRD2
- APLNR
- APOD
- APP
- ATP2A1
- ATP6AP1
- BAG1
- BDKRB2
- BHLHE40
- BIN1
- CACNA1H
- CACNG1
- CAMK2B
- CASQ1
- CASQ2
- CAV3
- CD36
- CDH13
- CDKN1A
- CFD
- CHRNA1
- CHRNB1
- CHRNG
- CKB
- CKM
- CKMT2
- CLU
- CNN3
- COL15A1
- COL1A1
- COL3A1
- COL4A2
- COL6A2
- COL6A3
- COX6A2
- COX7A1
- CRAT
- CRYAB
- CSRP3
- CTF1
- DAPK2
- DENND2B
- DES
- DMD
- DMPK
- DTNA
- EFS
- EIF4A2
- ENO3
- EPHB3
- ERBB3
- FABP3
- FDPS
- FGF2
- FHL1
- FKBP1B
- FLII
- FOXO4
- FST
- FXYD1
- GAA
- GABARAPL2
- GADD45B
- GJA5
- GNAO1
- GPX3
- GSN
- HBEGF
- HDAC5
- HRC
- HSPB2
- HSPB8
- IFRD1
- IGF1
- IGFBP3
- IGFBP7
- ITGA7
- ITGB1
- ITGB4
- ITGB5
- KCNH1
- KCNH2
- KIFC3
- KLF5
- LAMA2
- LARGE1
- LDB3
- LPIN1
- LSP1
- MAPK12
- MAPRE3
- MB
- MEF2A
- MEF2C
- MEF2D
- MRAS
- MYBPC3
- MYBPH
- MYF6
- MYH1
- MYH11
- MYH2
- MYH3
- MYH4
- MYH7
- MYH8
- MYH9
- MYL1
- MYL2
- MYL3
- MYL4
- MYL6B
- MYL7
- MYLK
- MYLPF
- MYO1C
- MYOG
- MYOM1
- MYOM2
- MYOZ1
- NAV2
- NCAM1
- NOS1
- NOTCH1
- NQO1
- OCEL1
- PC
- PDE4DIP
- PDLIM7
- PFKM
- PGAM2
- PICK1
- PKIA
- PLXNB2
- PPFIA4
- PPP1R3C
- PRNP
- PSEN2
- PTGIS
- PTP4A3
- PVALB
- PYGM
- RB1
- REEP1
- RIT1
- RYR1
- SCD
- SCHIP1
- SGCA
- SGCD
- SGCG
- SH2B1
- SH3BGR
- SIRT2
- SLC6A8
- SLN
- SMTN
- SOD3
- SORBS1
- SORBS3
- SPARC
- SPDEF
- SPEG
- SPHK1
- SPTAN1
- SSPN
- STC2
- SVIL
- SYNGR2
- TAGLN
- TCAP
- TEAD4
- TGFB1
- TNNC1
- TNNC2
- TNNI1
- TNNI2
- TNNT1
- TNNT2
- TNNT3
- TPD52L1
- TPM2
- TPM3
- TSC2
- VIPR1
- WWTR1
- More...
Gene association
Number of significant genes with P-value ≤ 10-6 for each cohorts are summarized in bar plots. The scatter plot highlights significant associations diven by protein rather than mRNA abundance.
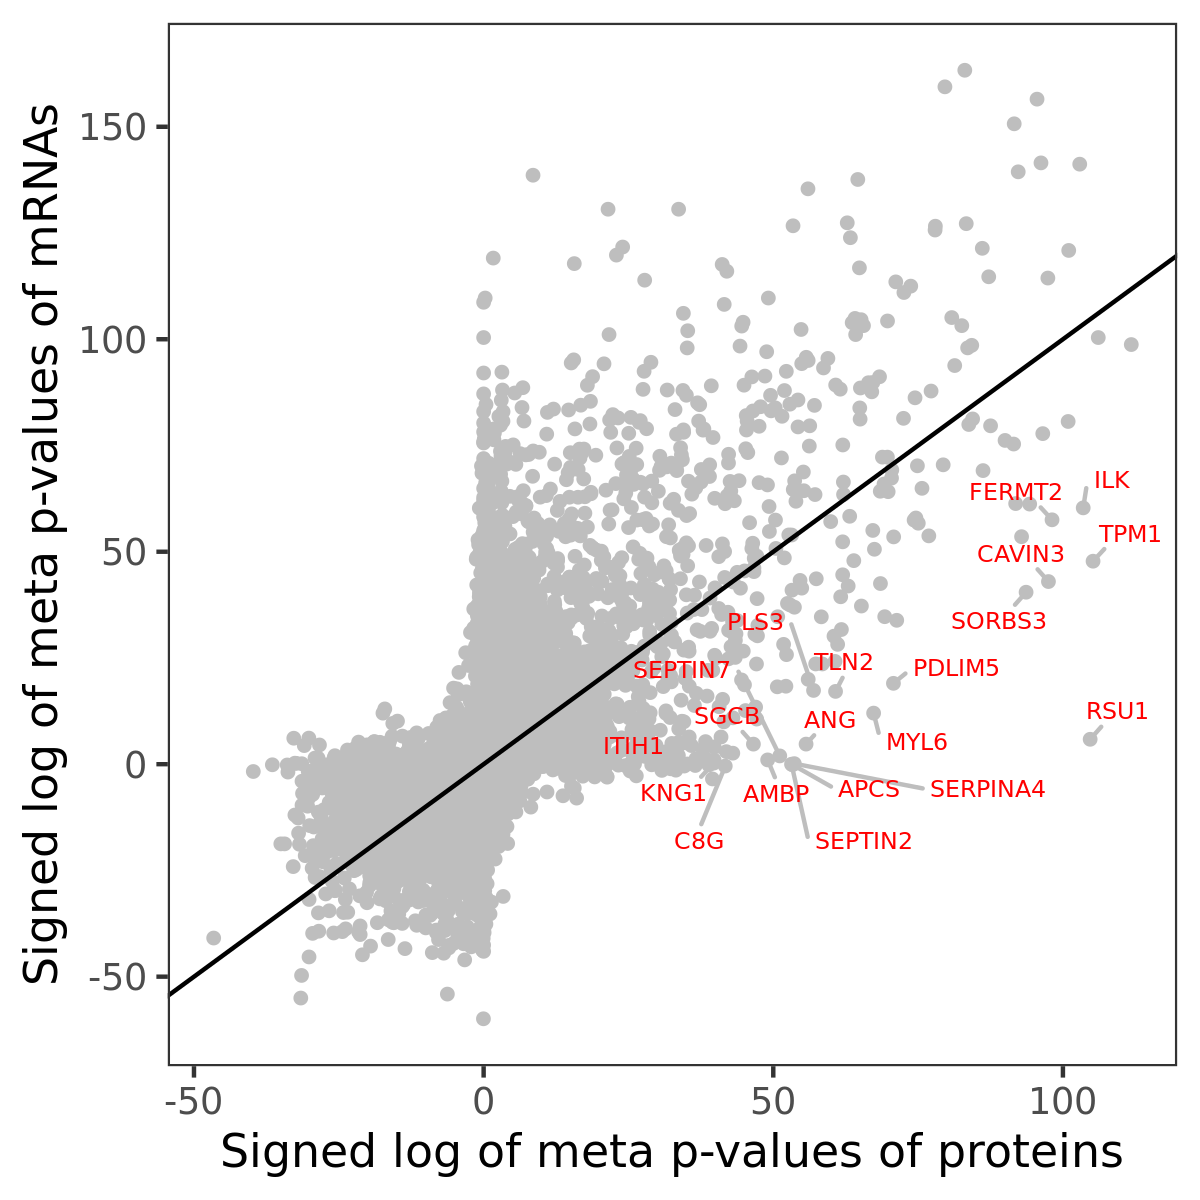
Association of protein abundance of genes
| Signed p-values | |||||||||||
|---|---|---|---|---|---|---|---|---|---|---|---|
| Gene | Meta P | BRCA | CCRCC | COAD | GBM | HNSCC | LSCC | LUAD | OV | PDAC | UCEC |
Gene set enrichment analysis
Submit genes and the common logarithm of the p-values of their association with HALLMARK_MYOGENESIS to WebGestalt.
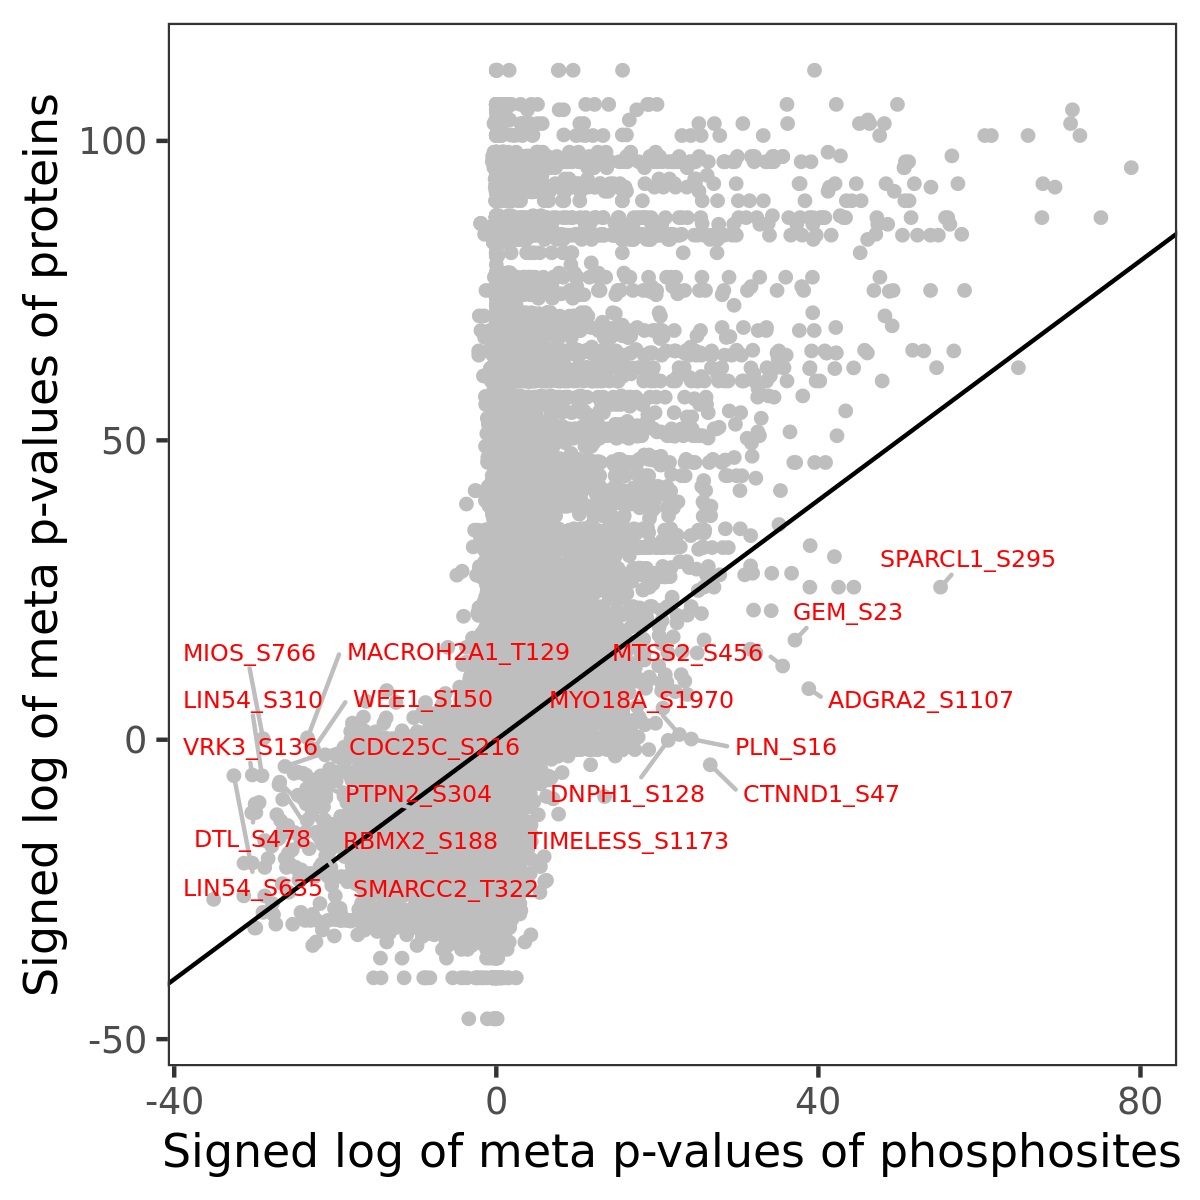
Phosphosite association
Number of significant genes with P-value ≤ 10-6 for each cohorts are summarized in the bar plot. The scatter plot highlights significant associations diven by phosphorylation rather than protein abundance.
| Signed p-values | |||||||||||||
|---|---|---|---|---|---|---|---|---|---|---|---|---|---|
| Gene | Protein | Site | Meta P | BRCA | CCRCC | COAD | GBM | HNSCC | LSCC | LUAD | OV | PDAC | UCEC |
Gene set enrichment analysis
Submit phosphorylation sites and the common logarithm of the p-values of their association with HALLMARK_MYOGENESIS to WebGestalt.