Basic information
- Phenotype
- xcell: B cell memory
- Description
- Enrichment score inferring the proportion of memory B cells in the tumor derived from RNA data using the xCell tool.
- Source
- https://genomebiology.biomedcentral.com/articles/10.1186/s13059-017-1349-1
- Method
- The R package immunedeconv (V2.0.4) (PMID: 31510660) was used to perform immune cell deconvolution using RNA expression data (TPM).
- Genes
-
- ADAM20
- ADAM21
- ADAM30
- ADAMTS12
- ADCY2
- AICDA
- AIPL1
- ANKRD34C
- AP1M2
- AQP8
- ART1
- BAIAP3
- BLK
- C4BPA
- CAPN3
- CASQ2
- CCR6
- CCR9
- CD180
- CD19
- CD1C
- CD22
- CD37
- CD3EAP
- CD72
- CD79A
- CD79B
- CER1
- CETP
- CHP2
- CHRM2
- CHRNA2
- CHST5
- CLDN17
- CNR2
- COLEC10
- COX6A2
- CPA2
- CPB1
- CRB1
- CSN1S1
- CXCL13
- CXCR5
- CYLC2
- CYP2A7
- CYP2C19
- DCC
- DDX4
- DPP6
- DSP
- FCRL2
- FMO1
- FSCN2
- FSCN3
- FSHR
- GABRA4
- GAD2
- GGA2
- GK2
- GLYAT
- GNAT2
- GNRHR
- GPRC5D
- GPX5
- GRIN2B
- GRM6
- HCRTR2
- HECW1
- HLA-DPB1
- HNRNPL
- HRH4
- HSD3B2
- HTN3
- HTR3A
- INHBC
- KALRN
- KCNA5
- KCNJ10
- KHDRBS2
- KIF5A
- KRT2
- KRT75
- LECT2
- LY86
- MAP3K9
- MBD4
- MBL2
- MC4R
- MEFV
- MEP1B
- MGAT5
- MIOS
- MOGAT2
- MS4A1
- MS4A5
- MYOZ3
- NCAN
- NPHS2
- NPY5R
- NT5C
- NTRK3
- OBSCN
- ODC1
- OTC
- PAX5
- PGLYRP4
- PIKFYVE
- PLIN1
- PNLIPRP1
- PNOC
- POU4F2
- PRKCB
- PROZ
- PRPH2
- PTH1R
- QRSL1
- RIC3
- RNGTT
- RRH
- S100G
- SCRN1
- SELP
- SERPINA4
- SHISA6
- SIGLEC6
- SLC12A3
- SLC17A1
- SLC17A7
- SLC24A2
- SLC30A10
- SLC5A7
- SLCO1C1
- SLN
- SP140
- SPIB
- SSX3
- STAP1
- SYN2
- SYPL1
- TAS2R14
- TCTN2
- TMPRSS11D
- TNFRSF13B
- TNFRSF17
- TRMT61A
- TRPM3
- TSHB
- TSPAN13
- ULK4
- UNC5C
- VN1R1
- VPREB3
- WNT16
- WNT2
- ZBTB32
- ZIC3
- ZNF548
- Array
- ZNF747
- Array
- More...
Gene association
Number of significant genes with P-value ≤ 10-6 for each cohorts are summarized in bar plots. The scatter plot highlights significant associations diven by protein rather than mRNA abundance.
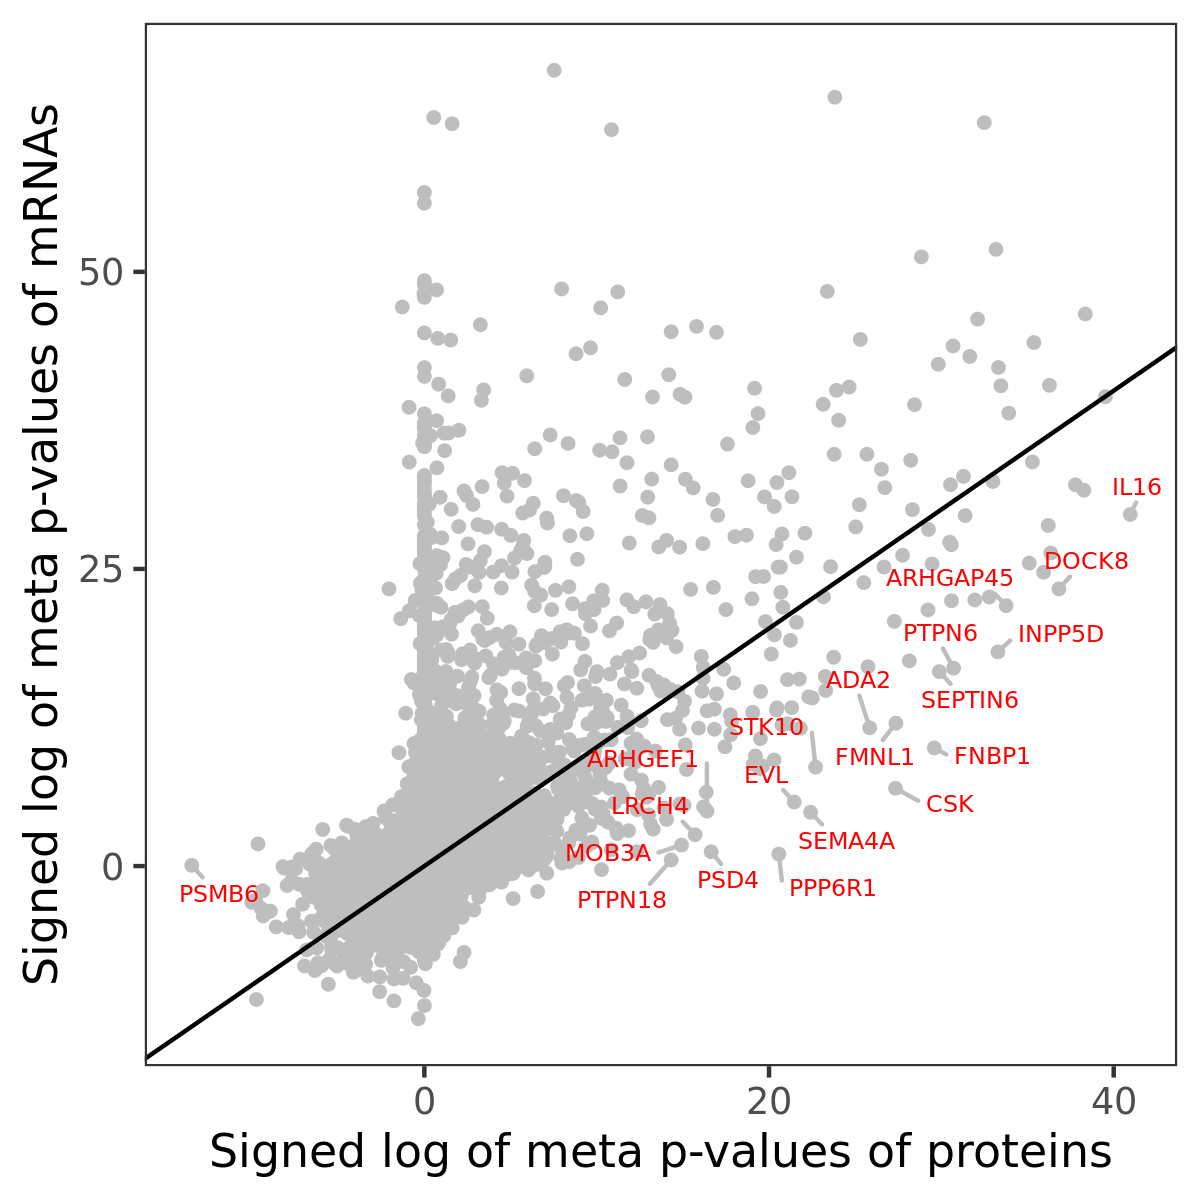
Association of protein abundance of genes
| Signed p-values | |||||||||||
|---|---|---|---|---|---|---|---|---|---|---|---|
| Gene | Meta P | BRCA | CCRCC | COAD | GBM | HNSCC | LSCC | LUAD | OV | PDAC | UCEC |
Gene set enrichment analysis
Submit genes and the common logarithm of the p-values of their association with xcell: B cell memory to WebGestalt.
Phosphosite association
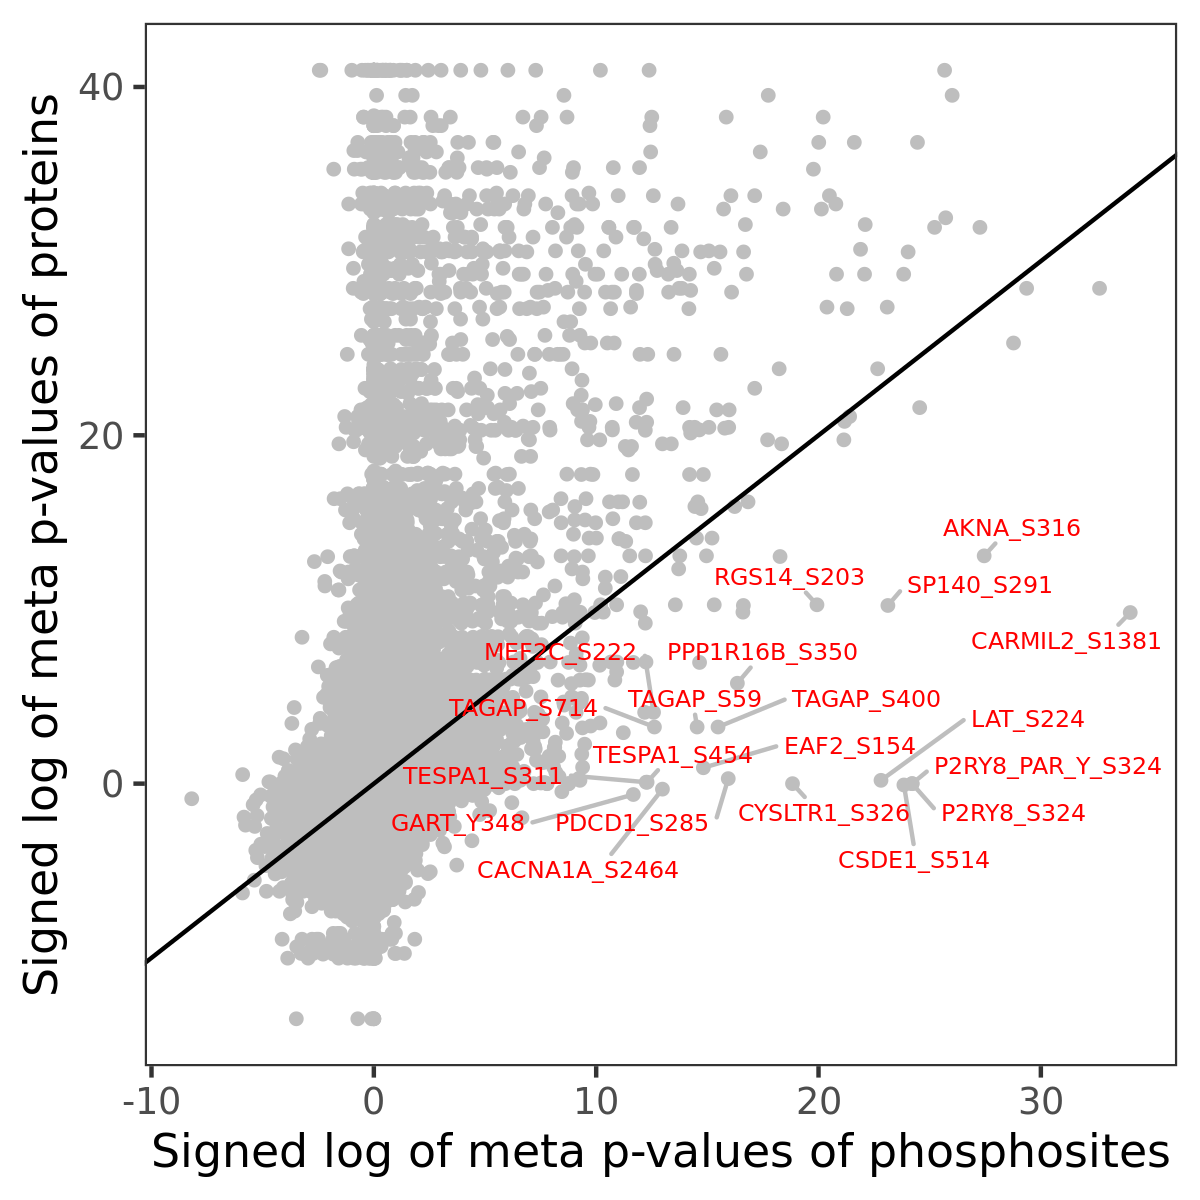
Number of significant genes with P-value ≤ 10-6 for each cohorts are summarized in the bar plot. The scatter plot highlights significant associations diven by phosphorylation rather than protein abundance.
| Signed p-values | |||||||||||||
|---|---|---|---|---|---|---|---|---|---|---|---|---|---|
| Gene | Protein | Site | Meta P | BRCA | CCRCC | COAD | GBM | HNSCC | LSCC | LUAD | OV | PDAC | UCEC |
Gene set enrichment analysis
Submit phosphorylation sites and the common logarithm of the p-values of their association with xcell: B cell memory to WebGestalt.