Basic information
- Phenotype
- HALLMARK_INFLAMMATORY_RESPONSE
- Description
- Enrichment score representing genes involved in the inflammatory response. The score was calculated using ssGSEA on the RNA data (Z-score transformed coding genes with expression in at least 50% of the samples in a cohort).
- Source
- http://www.gsea-msigdb.org/gsea/msigdb/cards/HALLMARK_INFLAMMATORY_RESPONSE.html
- Method
- Single sample gene set enrichment analysis (ssGSEA) was performed for each cancer type using gene-wise Z-scores of the RNA expression data (RSEM) for the MSigDB Hallmark gene sets v7.0 (PMID: 26771021) via the ssGSEA2.0 R package (PMID: 30563849). RNA data were filtered to coding genes with < 50% 0 expression. (Parameters: sample.norm.type="rank", weight=0.75, statistic="area.under.RES", nperm=1000, min.overlap=10). Pathway activity scores are normalized enrichment scores from ssGSEA.
- Genes
-
- ABI1
- ACVR1B
- ACVR2A
- ADGRE1
- ADM
- ADORA2B
- ADRM1
- AHR
- APLNR
- AQP9
- ATP2A2
- ATP2B1
- ATP2C1
- AXL
- BDKRB1
- BEST1
- BST2
- BTG2
- C3AR1
- C5AR1
- CALCRL
- CCL17
- CCL2
- CCL20
- CCL22
- CCL24
- CCL5
- CCL7
- CCR7
- CCRL2
- CD14
- CD40
- CD48
- CD55
- CD69
- CD70
- CD82
- CDKN1A
- CHST2
- CLEC5A
- CMKLR1
- CSF1
- CSF3
- CSF3R
- CX3CL1
- CXCL10
- CXCL11
- CXCL6
- CXCL8
- CXCL9
- CXCR6
- CYBB
- DCBLD2
- EBI3
- EDN1
- EIF2AK2
- EMP3
- EREG
- F3
- FFAR2
- FPR1
- FZD5
- GABBR1
- GCH1
- GNA15
- GNAI3
- GP1BA
- GPC3
- GPR132
- GPR183
- HAS2
- HBEGF
- HIF1A
- HPN
- HRH1
- ICAM1
- ICAM4
- ICOSLG
- IFITM1
- IFNAR1
- IFNGR2
- IL10
- IL10RA
- IL12B
- IL15
- IL15RA
- IL18
- IL18R1
- IL18RAP
- IL1A
- IL1B
- IL1R1
- IL2RB
- IL4R
- IL6
- IL7R
- INHBA
- IRAK2
- IRF1
- IRF7
- ITGA5
- ITGB3
- ITGB8
- KCNA3
- KCNJ2
- KCNMB2
- KIF1B
- KLF6
- LAMP3
- LCK
- LCP2
- LDLR
- LIF
- LPAR1
- LTA
- LY6E
- LYN
- MARCO
- MEFV
- MEP1A
- MET
- MMP14
- MSR1
- MXD1
- MYC
- NAMPT
- NDP
- NFKB1
- NFKBIA
- NLRP3
- NMI
- NMUR1
- NOD2
- NPFFR2
- OLR1
- OPRK1
- OSM
- OSMR
- P2RX4
- P2RX7
- P2RY2
- PCDH7
- PDE4B
- PDPN
- PIK3R5
- PLAUR
- PROK2
- PSEN1
- PTAFR
- PTGER2
- PTGER4
- PTGIR
- PTPRE
- PVR
- RAF1
- RASGRP1
- RELA
- RGS1
- RGS16
- RHOG
- RIPK2
- RNF144B
- ROS1
- RTP4
- SCARF1
- SCN1B
- SELE
- SELENOS
- SELL
- SEMA4D
- SERPINE1
- SGMS2
- SLAMF1
- SLC11A2
- SLC1A2
- SLC28A2
- SLC31A1
- SLC31A2
- SLC4A4
- SLC7A1
- SLC7A2
- SPHK1
- SRI
- STAB1
- TACR1
- TACR3
- TAPBP
- TIMP1
- TLR1
- TLR2
- TLR3
- TNFAIP6
- TNFRSF1B
- TNFRSF9
- TNFSF10
- TNFSF15
- TNFSF9
- TPBG
- VIP
- More...
Gene association
Number of significant genes with P-value ≤ 10-6 for each cohorts are summarized in bar plots. The scatter plot highlights significant associations diven by protein rather than mRNA abundance.
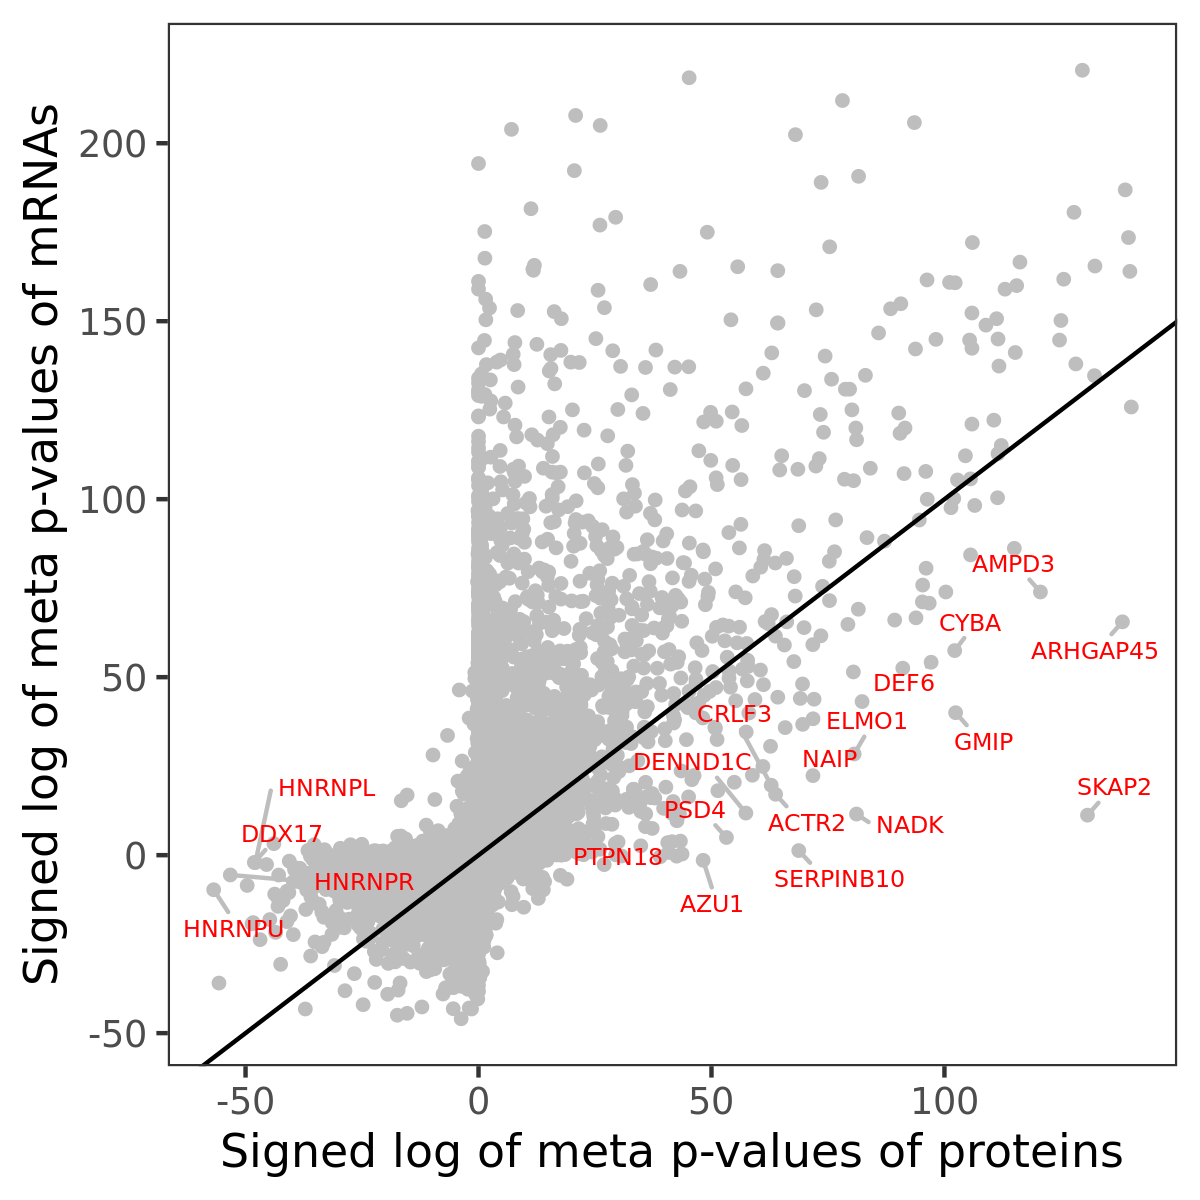
Association of protein abundance of genes
| Signed p-values | |||||||||||
|---|---|---|---|---|---|---|---|---|---|---|---|
| Gene | Meta P | BRCA | CCRCC | COAD | GBM | HNSCC | LSCC | LUAD | OV | PDAC | UCEC |
Gene set enrichment analysis
Submit genes and the common logarithm of the p-values of their association with HALLMARK_INFLAMMATORY_RESPONSE to WebGestalt.
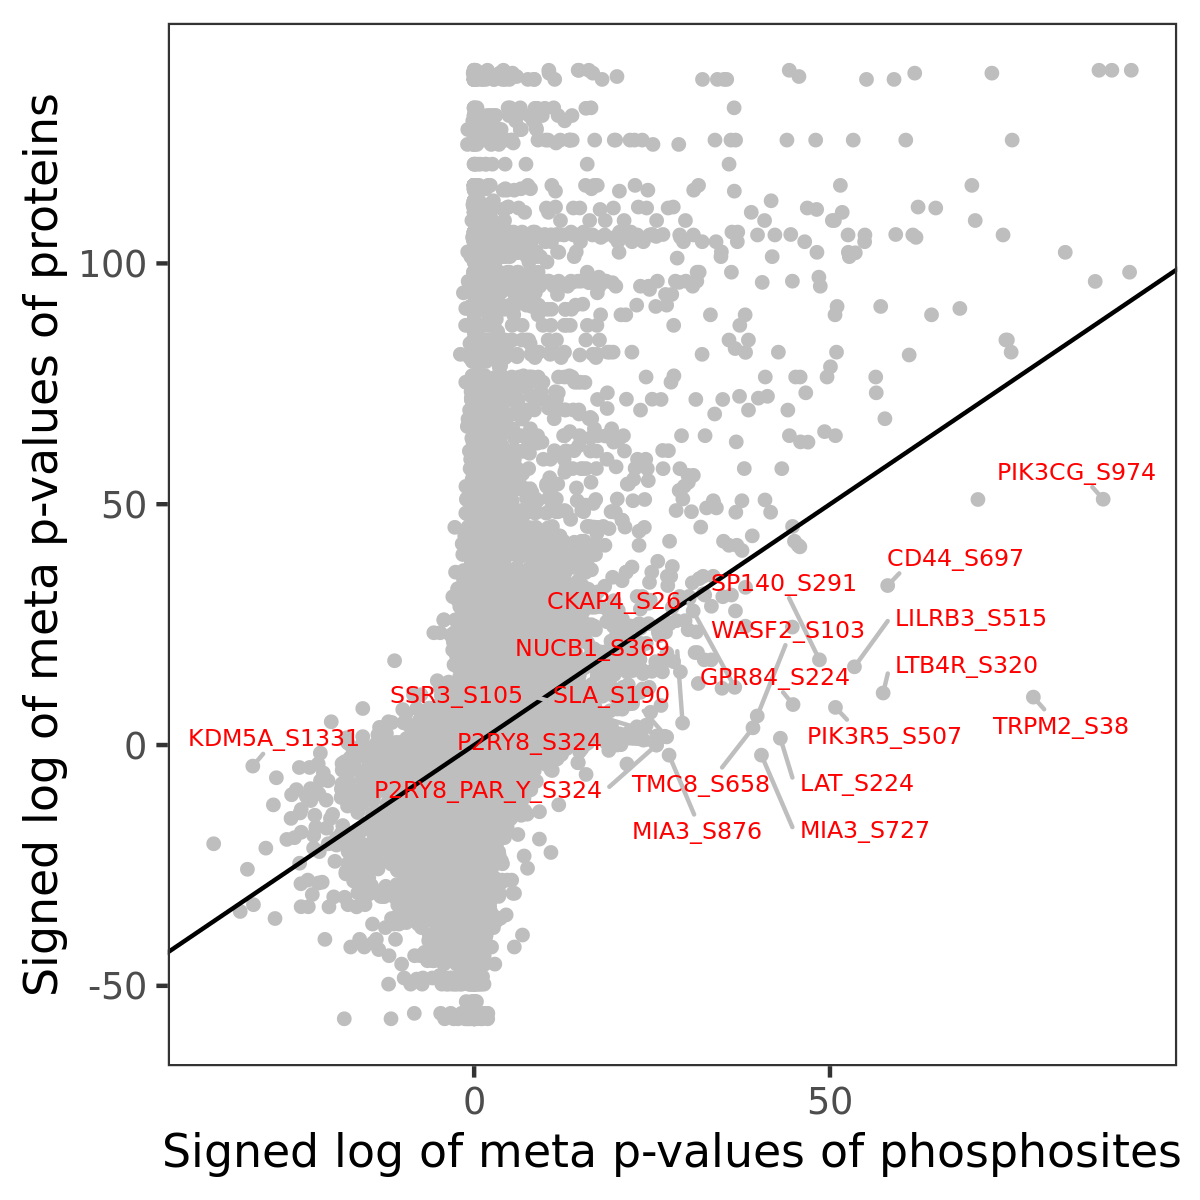
Phosphosite association
Number of significant genes with P-value ≤ 10-6 for each cohorts are summarized in the bar plot. The scatter plot highlights significant associations diven by phosphorylation rather than protein abundance.
| Signed p-values | |||||||||||||
|---|---|---|---|---|---|---|---|---|---|---|---|---|---|
| Gene | Protein | Site | Meta P | BRCA | CCRCC | COAD | GBM | HNSCC | LSCC | LUAD | OV | PDAC | UCEC |
Gene set enrichment analysis
Submit phosphorylation sites and the common logarithm of the p-values of their association with HALLMARK_INFLAMMATORY_RESPONSE to WebGestalt.