Basic information
- Phenotype
- HALLMARK_INTERFERON_GAMMA_RESPONSE
- Description
- Enrichment score representing the interferon gamma response. The score was calculated using ssGSEA on the RNA data (Z-score transformed coding genes with expression in at least 50% of the samples in a cohort).
- Source
- http://www.gsea-msigdb.org/gsea/msigdb/cards/HALLMARK_INTERFERON_GAMMA_RESPONSE.html
- Method
- Single sample gene set enrichment analysis (ssGSEA) was performed for each cancer type using gene-wise Z-scores of the RNA expression data (RSEM) for the MSigDB Hallmark gene sets v7.0 (PMID: 26771021) via the ssGSEA2.0 R package (PMID: 30563849). RNA data were filtered to coding genes with < 50% 0 expression. (Parameters: sample.norm.type="rank", weight=0.75, statistic="area.under.RES", nperm=1000, min.overlap=10). Pathway activity scores are normalized enrichment scores from ssGSEA.
- Genes
-
- APOL6
- ARID5B
- ARL4A
- AUTS2
- B2M
- BANK1
- BATF2
- BPGM
- BST2
- BTG1
- C1R
- C1S
- CASP1
- CASP3
- CASP4
- CASP7
- CASP8
- CCL2
- CCL5
- CCL7
- CD274
- CD38
- CD40
- CD69
- CD74
- CD86
- CDKN1A
- CFB
- CFH
- CIITA
- CMKLR1
- CMPK2
- CMTR1
- CSF2RB
- CXCL10
- CXCL11
- CXCL9
- DDX58
- DDX60
- DHX58
- EIF2AK2
- EIF4E3
- EPSTI1
- FAS
- FCGR1A
- FGL2
- FPR1
- GBP4
- GBP6
- GCH1
- GPR18
- GZMA
- HELZ2
- HERC6
- HIF1A
- HLA-A
- HLA-B
- HLA-DMA
- HLA-DQA1
- HLA-DRB1
- HLA-G
- ICAM1
- IDO1
- IFI27
- IFI30
- IFI35
- IFI44
- IFI44L
- IFIH1
- IFIT1
- IFIT2
- IFIT3
- IFITM2
- IFITM3
- IFNAR2
- IL10RA
- IL15
- IL15RA
- IL18BP
- IL2RB
- IL4R
- IL6
- IL7
- IRF1
- IRF2
- IRF4
- IRF5
- IRF7
- IRF8
- IRF9
- ISG15
- ISG20
- ISOC1
- ITGB7
- JAK2
- KLRK1
- LAP3
- LATS2
- LCP2
- LGALS3BP
- LY6E
- LYSMD2
- MARCHF1
- METTL7B
- MT2A
- MTHFD2
- MVP
- MX1
- MX2
- MYD88
- NAMPT
- NCOA3
- NFKB1
- NFKBIA
- NLRC5
- NMI
- NOD1
- NUP93
- OAS2
- OAS3
- OASL
- OGFR
- P2RY14
- PARP12
- PARP14
- PDE4B
- PELI1
- PFKP
- PIM1
- PLA2G4A
- PLSCR1
- PML
- PNP
- PNPT1
- PSMA2
- PSMA3
- PSMB10
- PSMB2
- PSMB8
- PSMB9
- PSME1
- PSME2
- PTGS2
- PTPN1
- PTPN2
- PTPN6
- RAPGEF6
- RBCK1
- RIPK1
- RIPK2
- RNF31
- RSAD2
- RTP4
- SAMD9L
- SAMHD1
- SECTM1
- SELP
- SERPING1
- SLAMF7
- SLC25A28
- SOCS1
- SOCS3
- SOD2_ENSG00000285441
- SP110
- SPPL2A
- SRI
- SSPN
- ST3GAL5
- ST8SIA4
- STAT1
- STAT2
- STAT3
- STAT4
- TAP1
- TAPBP
- TDRD7
- TNFAIP2
- TNFAIP3
- TNFAIP6
- TNFSF10
- TOR1B
- TRAFD1
- TRIM14
- TRIM21
- TRIM25
- TRIM26
- TXNIP
- UBE2L6
- UPP1
- USP18
- VAMP5
- VAMP8
- VCAM1
- WARS1
- XAF1
- XCL1
- ZBP1
- Array
- ZNFX1
- More...
Gene association
Number of significant genes with P-value ≤ 10-6 for each cohorts are summarized in bar plots. The scatter plot highlights significant associations diven by protein rather than mRNA abundance.
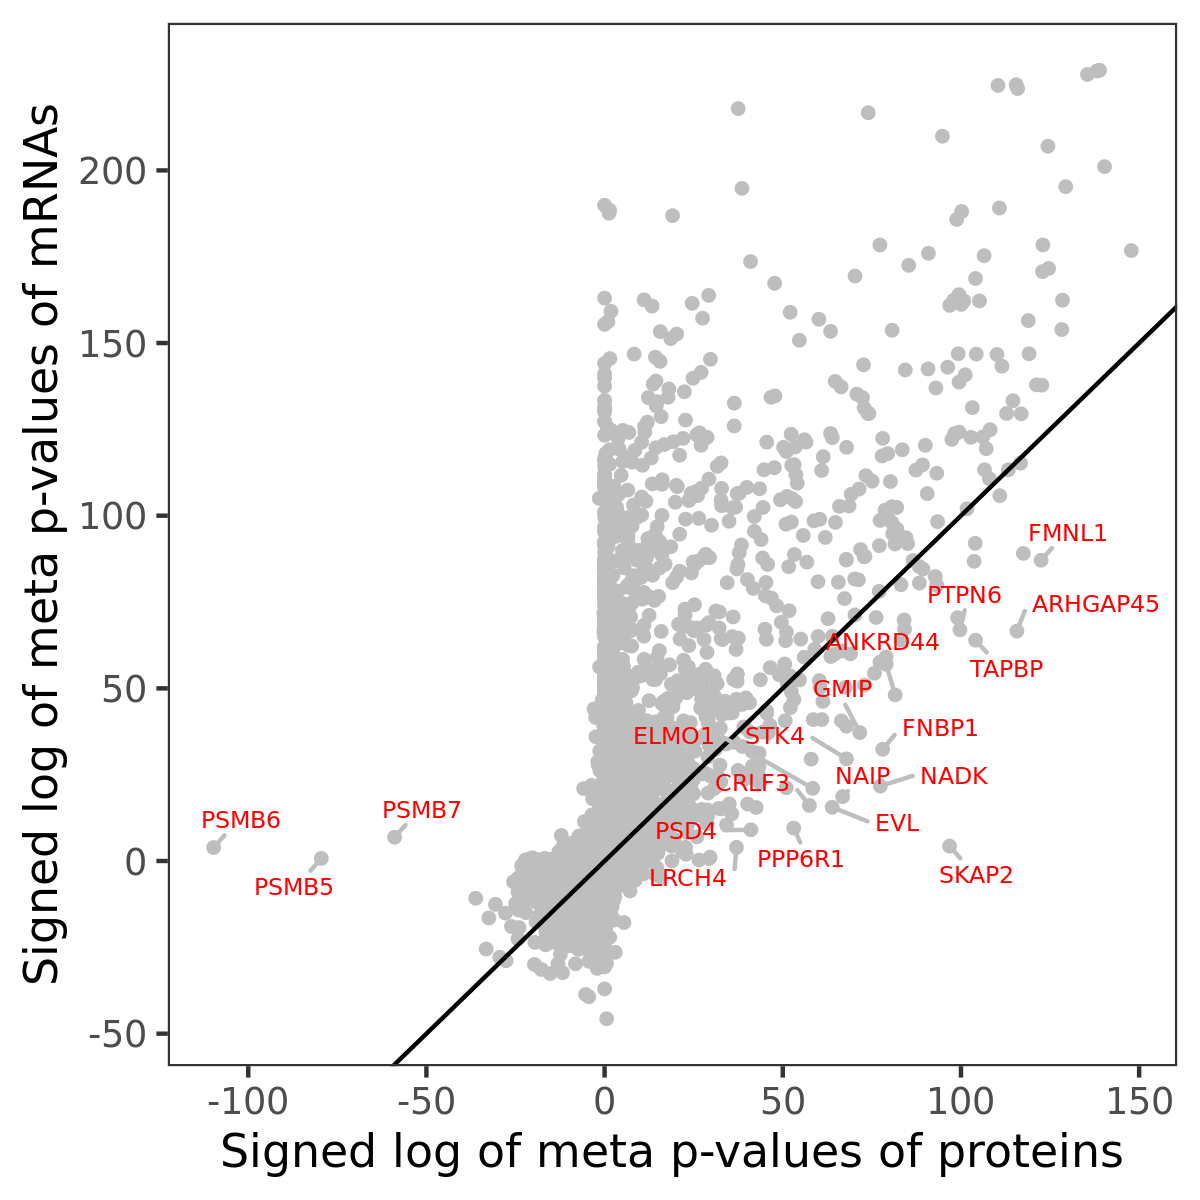
Association of protein abundance of genes
| Signed p-values | |||||||||||
|---|---|---|---|---|---|---|---|---|---|---|---|
| Gene | Meta P | BRCA | CCRCC | COAD | GBM | HNSCC | LSCC | LUAD | OV | PDAC | UCEC |
Gene set enrichment analysis
Submit genes and the common logarithm of the p-values of their association with HALLMARK_INTERFERON_GAMMA_RESPONSE to WebGestalt.
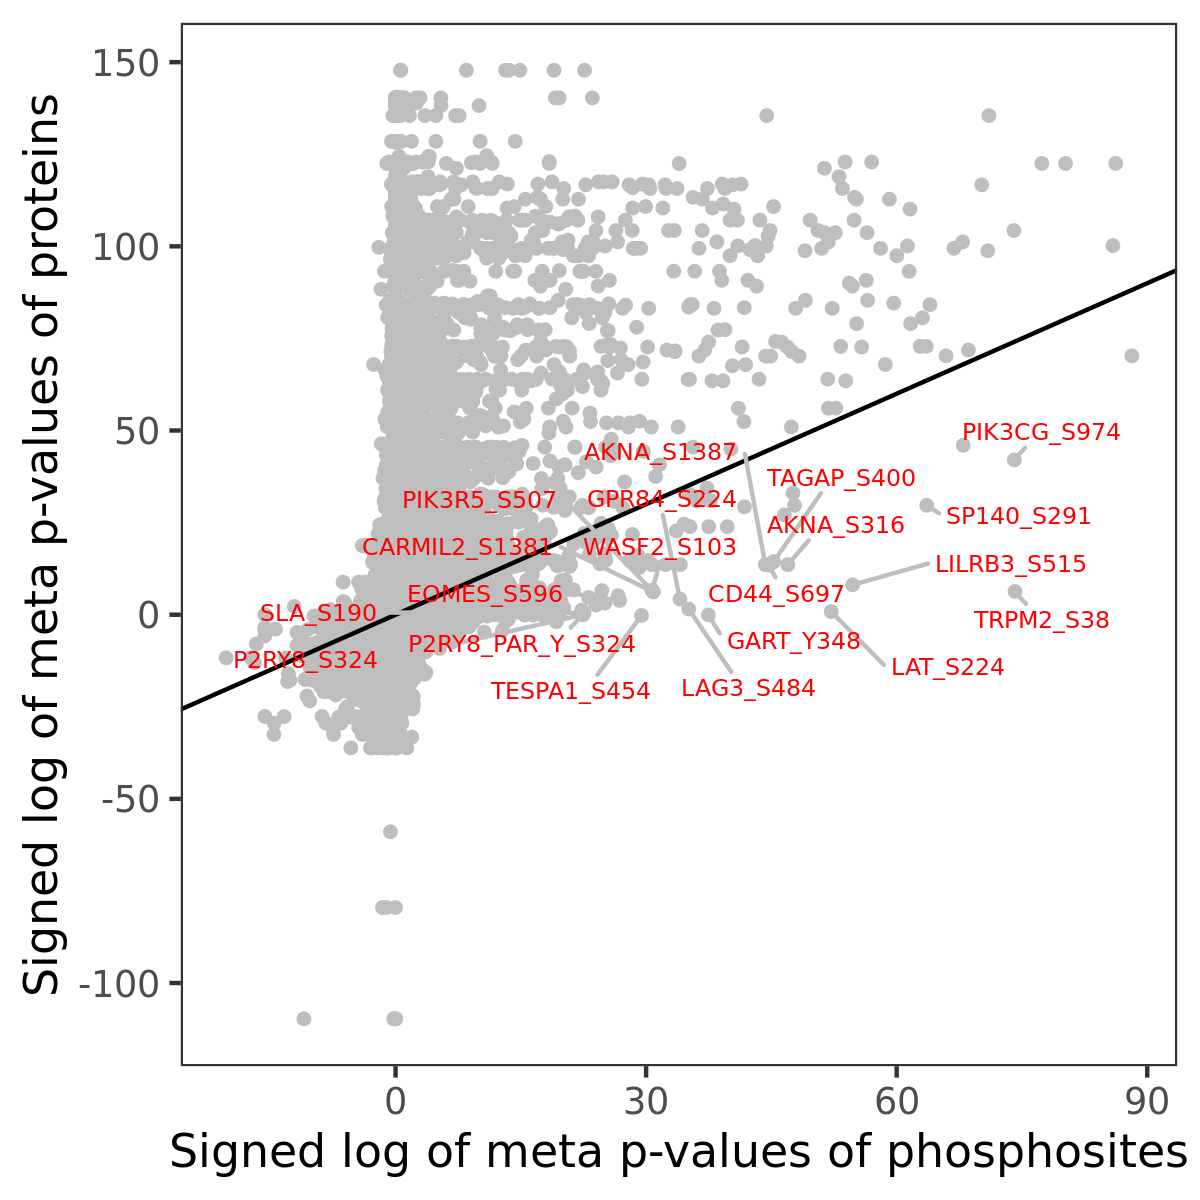
Phosphosite association
Number of significant genes with P-value ≤ 10-6 for each cohorts are summarized in the bar plot. The scatter plot highlights significant associations diven by phosphorylation rather than protein abundance.
| Signed p-values | |||||||||||||
|---|---|---|---|---|---|---|---|---|---|---|---|---|---|
| Gene | Protein | Site | Meta P | BRCA | CCRCC | COAD | GBM | HNSCC | LSCC | LUAD | OV | PDAC | UCEC |
Gene set enrichment analysis
Submit phosphorylation sites and the common logarithm of the p-values of their association with HALLMARK_INTERFERON_GAMMA_RESPONSE to WebGestalt.