Basic information
- Phenotype
- HALLMARK_TNFA_SIGNALING_VIA_NFKB
- Description
- Enrichment score representing TNFa signaling via NFkB. The score was calculated using ssGSEA on the RNA data (Z-score transformed coding genes with expression in at least 50% of the samples in a cohort).
- Source
- http://www.gsea-msigdb.org/gsea/msigdb/cards/HALLMARK_TNFA_SIGNALING_VIA_NFKB.html
- Method
- Single sample gene set enrichment analysis (ssGSEA) was performed for each cancer type using gene-wise Z-scores of the RNA expression data (RSEM) for the MSigDB Hallmark gene sets v7.0 (PMID: 26771021) via the ssGSEA2.0 R package (PMID: 30563849). RNA data were filtered to coding genes with < 50% 0 expression. (Parameters: sample.norm.type="rank", weight=0.75, statistic="area.under.RES", nperm=1000, min.overlap=10). Pathway activity scores are normalized enrichment scores from ssGSEA.
- Genes
-
- ACKR3
- AREG
- ATF3
- ATP2B1
- B4GALT1
- B4GALT5
- BCL2A1
- BCL3
- BCL6
- BHLHE40
- BIRC2
- BIRC3
- BMP2
- BTG1
- BTG2
- BTG3
- CCL2
- CCL20
- CCL4
- CCL5
- CCN1
- CCND1
- CCNL1
- CCRL2
- CD44
- CD69
- CD80
- CD83
- CDKN1A
- CEBPB
- CEBPD
- CFLAR
- CLCF1
- CSF1
- CSF2
- CXCL1
- CXCL10
- CXCL11
- CXCL2
- CXCL3
- CXCL6
- DDX58
- DENND5A
- DNAJB4
- DRAM1
- DUSP1
- DUSP2
- DUSP4
- DUSP5
- EDN1
- EFNA1
- EGR1
- EGR2
- EGR3
- EHD1
- EIF1
- ETS2
- F2RL1
- F3
- FJX1
- FOS
- FOSB
- FOSL1
- FOSL2
- FUT4
- G0S2
- GADD45A
- GADD45B
- GCH1
- GEM
- GFPT2
- GPR183
- HBEGF
- HES1
- ICAM1
- ICOSLG
- ID2
- IER2
- IER3
- IER5
- IFIH1
- IFIT2
- IFNGR2
- IL12B
- IL15RA
- IL18
- IL1A
- IL1B
- IL23A
- IL6
- IL6ST
- IL7R
- INHBA
- IRF1
- IRS2
- JAG1
- JUN
- JUNB
- KDM6B
- KLF10
- KLF2
- KLF4
- KLF6
- KLF9
- KYNU
- LAMB3
- LDLR
- LIF
- LITAF
- MAFF
- MAP2K3
- MAP3K8
- MARCKS
- MCL1
- MSC
- MXD1
- MYC
- NAMPT
- NFAT5
- NFE2L2
- NFIL3
- NFKB1
- NFKB2
- NFKBIA
- NFKBIE
- NINJ1
- NR4A1
- NR4A2
- NR4A3
- OLR1
- PANX1
- PDE4B
- PDLIM5
- PFKFB3
- PHLDA1
- PHLDA2
- PLAU
- PLAUR
- PLEK
- PLK2
- PLPP3
- PMEPA1
- PNRC1
- PPP1R15A
- PTGER4
- PTGS2
- PTPRE
- PTX3
- RCAN1
- REL
- RELA
- RELB
- RHOB
- RIPK2
- RNF19B
- SAT1
- SDC4
- SERPINB2
- SERPINB8
- SERPINE1
- SGK1
- SIK1
- SLC16A6
- SLC2A3
- SLC2A6
- SMAD3
- SNN
- SOCS3
- SOD2_ENSG00000285441
- SPHK1
- SPSB1
- SQSTM1
- STAT5A
- TANK
- TAP1
- TGIF1
- TIPARP
- TLR2
- TNC
- TNF
- TNFAIP2
- TNFAIP3
- TNFAIP6
- TNFAIP8
- TNFRSF9
- TNFSF9
- TNIP1
- TNIP2
- TRAF1
- TRIB1
- TRIP10
- TSC22D1
- TUBB2A
- VEGFA
- YRDC
- Array
- ZBTB10
- ZC3H12A
- ZFP36
- More...
Gene association
Number of significant genes with P-value ≤ 10-6 for each cohorts are summarized in bar plots. The scatter plot highlights significant associations diven by protein rather than mRNA abundance.
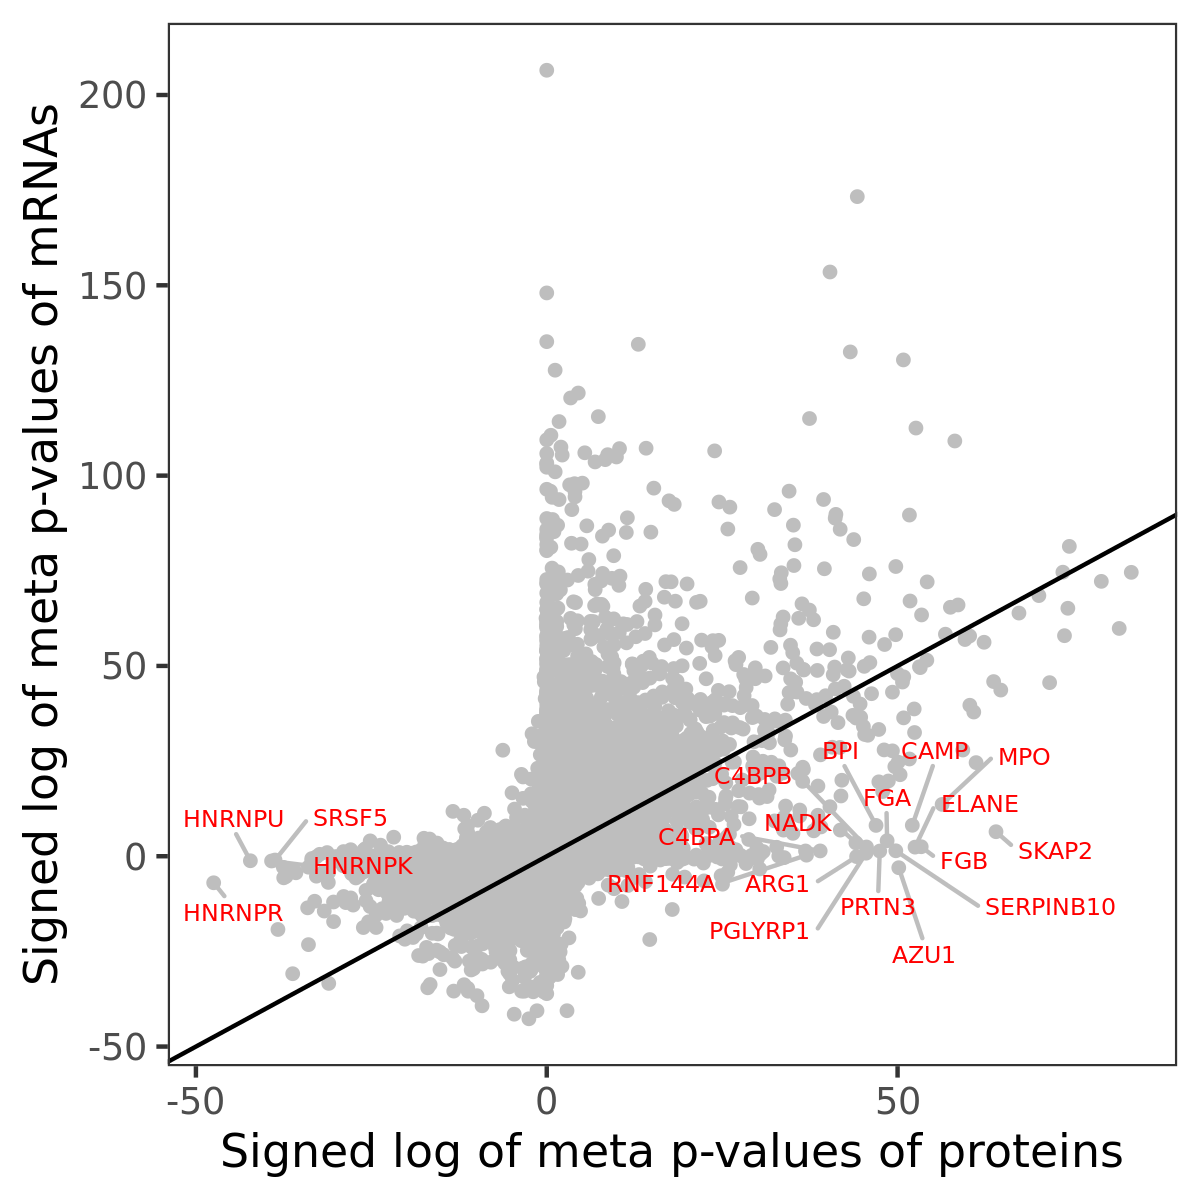
Association of protein abundance of genes
Signed p-values | ||||||||||||
|---|---|---|---|---|---|---|---|---|---|---|---|---|
Gene | Meta P | BRCA | CCRCC | COAD | GBM | HNSCC | LSCC | LUAD | OV | PDAC | UCEC | |
| No matching records found | ||||||||||||
Gene set enrichment analysis
Submit genes and the common logarithm of the p-values of their association with HALLMARK_TNFA_SIGNALING_VIA_NFKB to WebGestalt.
Phosphosite association
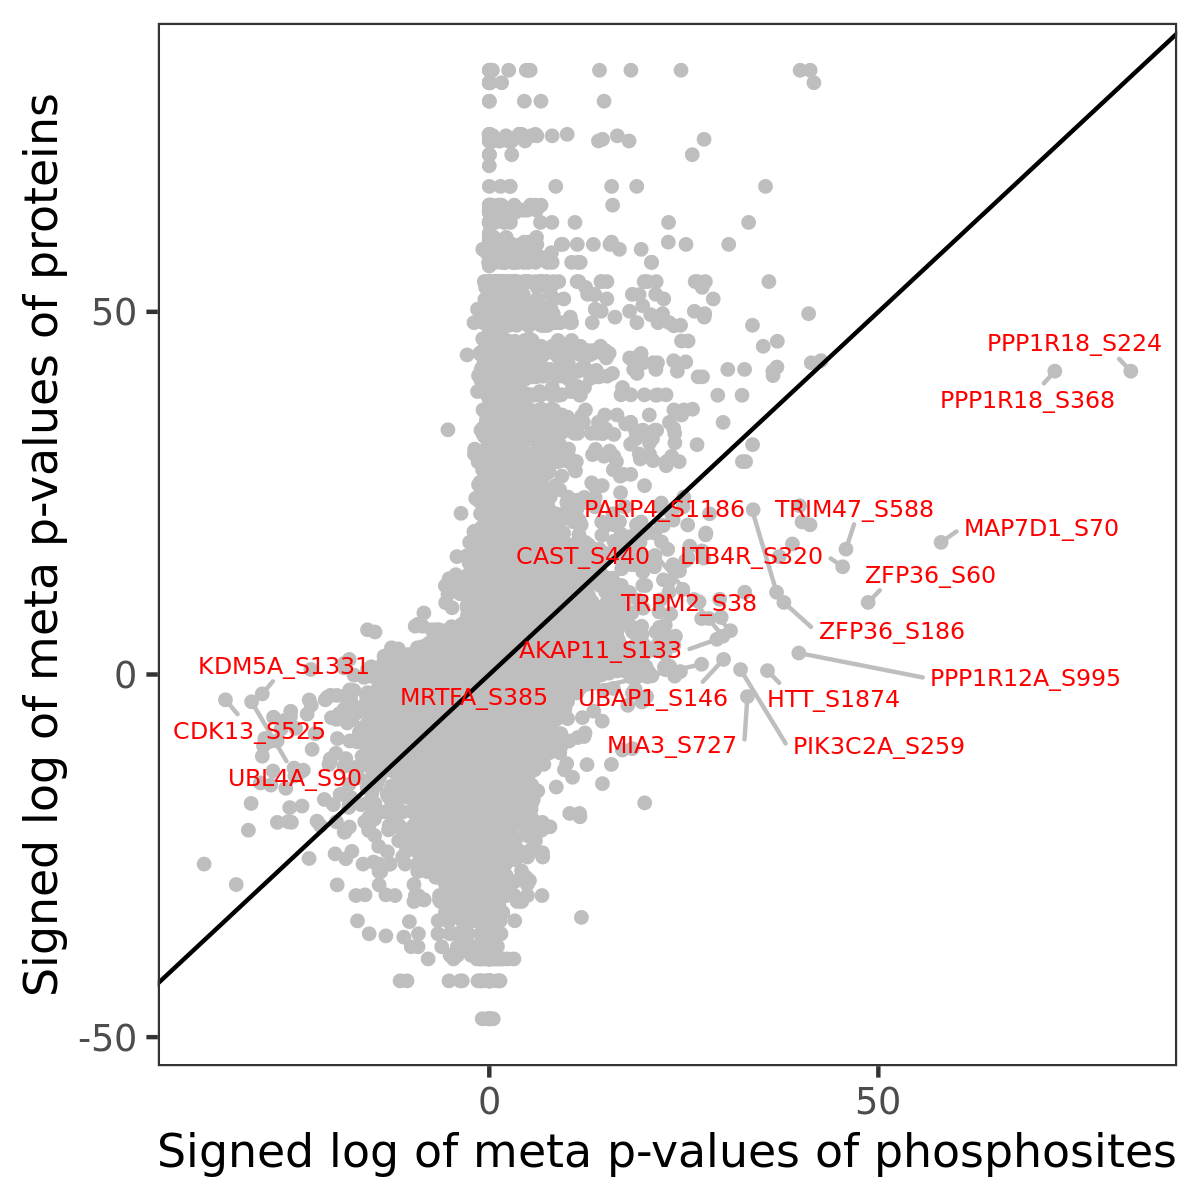
Number of significant genes with P-value ≤ 10-6 for each cohorts are summarized in the bar plot. The scatter plot highlights significant associations diven by phosphorylation rather than protein abundance.
Signed p-values | |||||||||||||
|---|---|---|---|---|---|---|---|---|---|---|---|---|---|
Gene | Protein | Site | Meta P | BRCA | CCRCC | COAD | GBM | HNSCC | LSCC | LUAD | OV | PDAC | UCEC |
| No matching records found | |||||||||||||
Gene set enrichment analysis
Submit phosphorylation sites and the common logarithm of the p-values of their association with HALLMARK_TNFA_SIGNALING_VIA_NFKB to WebGestalt.