Basic information
- Phenotype
- xcell: T cell CD4+ memory
- Description
- Enrichment score inferring the proportion of memory CD4+ T cells in the tumor derived from RNA data using the xCell tool.
- Source
- https://genomebiology.biomedcentral.com/articles/10.1186/s13059-017-1349-1
- Method
- The R package immunedeconv (V2.0.4) (PMID: 31510660) was used to perform immune cell deconvolution using RNA expression data (TPM).
- Genes
-
- ACD
- ACTL6A
- ADSL
- AHCTF1
- AKT2
- AMBRA1
- ANP32B
- ANXA7
- API5
- ARHGAP15
- ARL2
- ARPC4
- ATF1
- ATG5
- ATXN10
- AURKAIP1
- BAG3
- BCAS2
- BTF3
- BUB3
- C11orf58
- C12orf29
- CBLL1
- CBX3
- CCNC
- CCR4
- CD2
- CD226
- CD28
- CD2AP
- CD3G
- CD40LG
- CD5
- CD6
- CD96
- CDC40
- CDK9
- CDKN2AIP
- CDV3
- CEP57
- CETN3
- CLPX
- CMPK1
- CNBP
- COPS4
- COPS5
- COX7C
- CPSF6
- CSNK1A1
- CSNK2A2
- CTBP1
- CTLA4
- CXCR6
- DAD1
- DAP3
- DBF4
- DDX3X
- DDX50
- DENR
- DLEC1
- DNAJA2
- DNAJB1
- DOHH
- DPM1
- DR1
- EEF2
- EID1
- EIF2B5
- EIF3E
- EIF3L
- EIF3M
- EIF4G2
- ERH
- ESD
- ETAA1
- EXOC2
- FARS2
- FCF1
- FNTA
- FUBP3
- FXR1
- GABPA
- GALR2
- GATAD2A
- GLOD4
- GLUD1
- GPR132
- GPR15
- GPR171
- GPR183
- GRPEL1
- GZMA
- GZMK
- HDAC1
- HINT1
- HMGB2
- HMGN4
- HMOX2
- HNRNPA0
- HNRNPH3
- HNRNPU
- ICOS
- IMP3
- INTS8
- ISCA1
- ITK
- JAK3
- KBTBD4
- KIF22
- KTN1
- LDHB
- LIMS1
- LIN7C
- MAEA
- MAGOH
- MATR3
- MATR3_ENSG00000280987
- MEN1
- METAP1
- METTL5
- MMADHC
- MRPL11
- MRPL20
- MRPL44
- MRPS18B
- MRPS27
- MRPS34
- NAE1
- NCL
- NDUFS5
- NKRF
- OSGEP
- PABPC4
- PAPOLA
- PCID2
- PCNP
- PDCD1
- PDCD10
- PFDN6
- PFN1
- PKP4
- PLP2
- POLD2
- PPA2
- PPID
- PPIH
- PPP1CB
- PPP1CC
- PPP2R5D
- PPP6C
- PREPL
- PRPF18
- PRPF19
- PSMF1
- PTGES3
- PTPN11
- PTPN4
- RAD21
- RANBP1
- RANBP9
- RBL2
- RBM3
- RBM34
- RGS1
- RNF34
- RNF6
- RPF1
- RPL13
- RPL13A
- RPL36
- RPL4
- RPL5
- RPL8
- RPS19
- RPS3
- RPS6
- RRP1B
- RSL24D1
- RUVBL1
- RWDD1
- SAFB2
- SEC23IP
- SERP1
- SH2D1A
- SLAMF1
- SLC25A38
- SLC25A6
- SLC25A6_PAR_Y
- SMAD2
- SMC5
- SMU1
- SOD1
- SP3
- SPAG16
- SRP9
- SSNA1
- STK16
- SUB1
- SUCLG1
- SURF2
- TBL3
- THAP11
- THOC7
- THOP1
- THRAP3
- TINF2
- TPP2
- TPT1
- TRA2A
- TRAT1
- TRMT112
- TSN
- TTC37
- U2AF2
- UBASH3A
- UBE2D2
- UBE2D3
- UBE2N
- UBIAD1
- UBQLN2
- UNC45A
- UQCRC2
- USP39
- UXT
- WDR46
- ZC3H15
- ZDHHC6
- ZNF236
- More...
Gene association
Number of significant genes with P-value ≤ 10-6 for each cohorts are summarized in bar plots. The scatter plot highlights significant associations diven by protein rather than mRNA abundance.
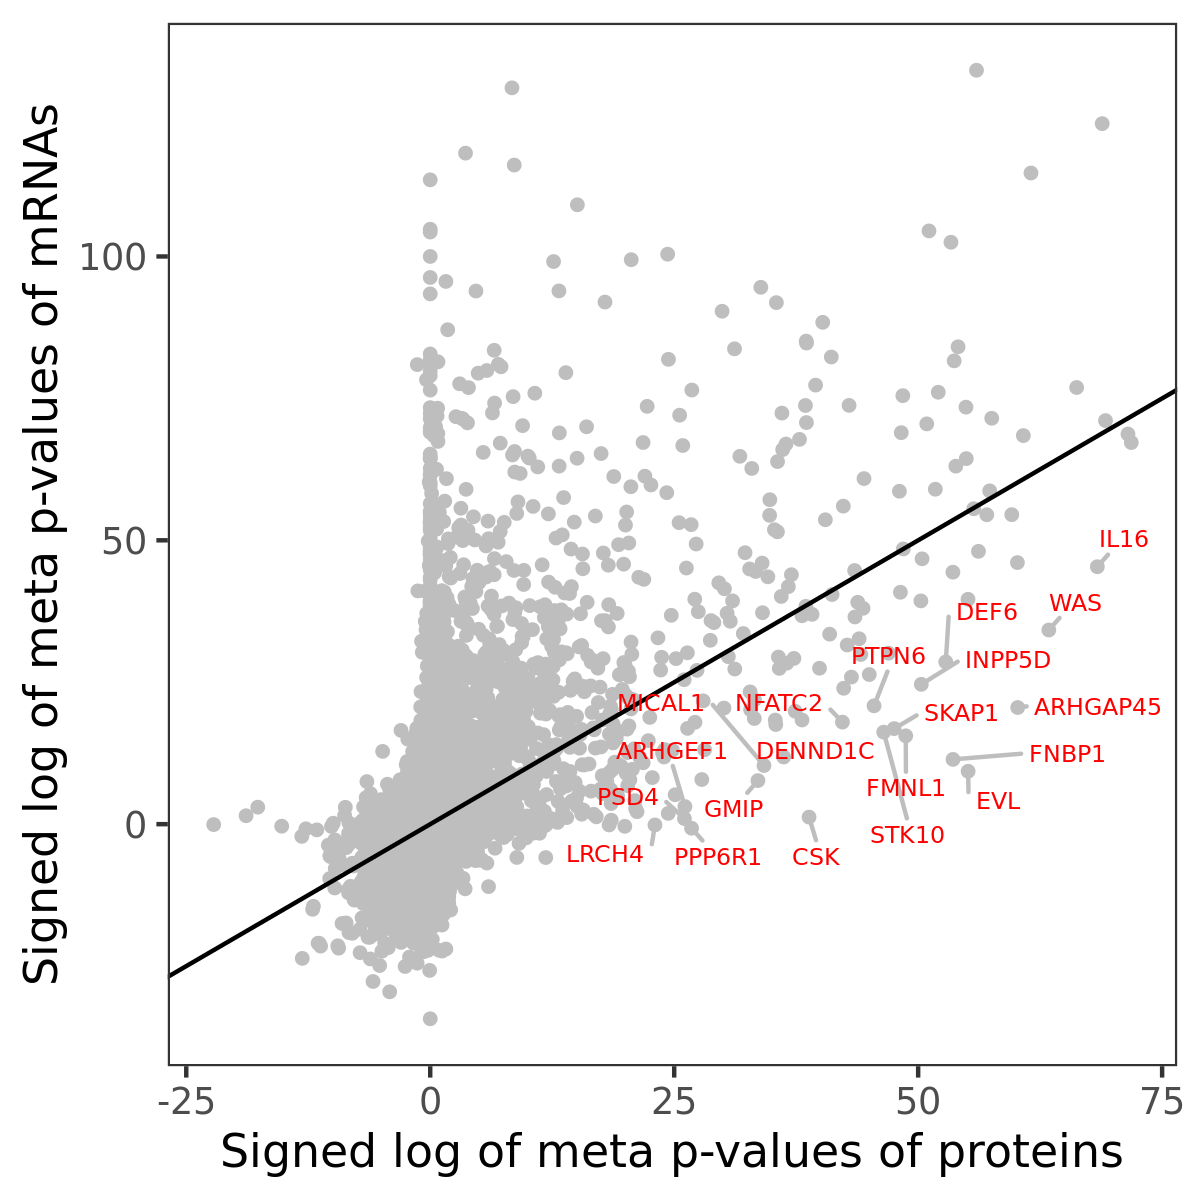
Association of protein abundance of genes
| Signed p-values | |||||||||||
|---|---|---|---|---|---|---|---|---|---|---|---|
| Gene | Meta P | BRCA | CCRCC | COAD | GBM | HNSCC | LSCC | LUAD | OV | PDAC | UCEC |
Gene set enrichment analysis
Submit genes and the common logarithm of the p-values of their association with xcell: T cell CD4+ memory to WebGestalt.
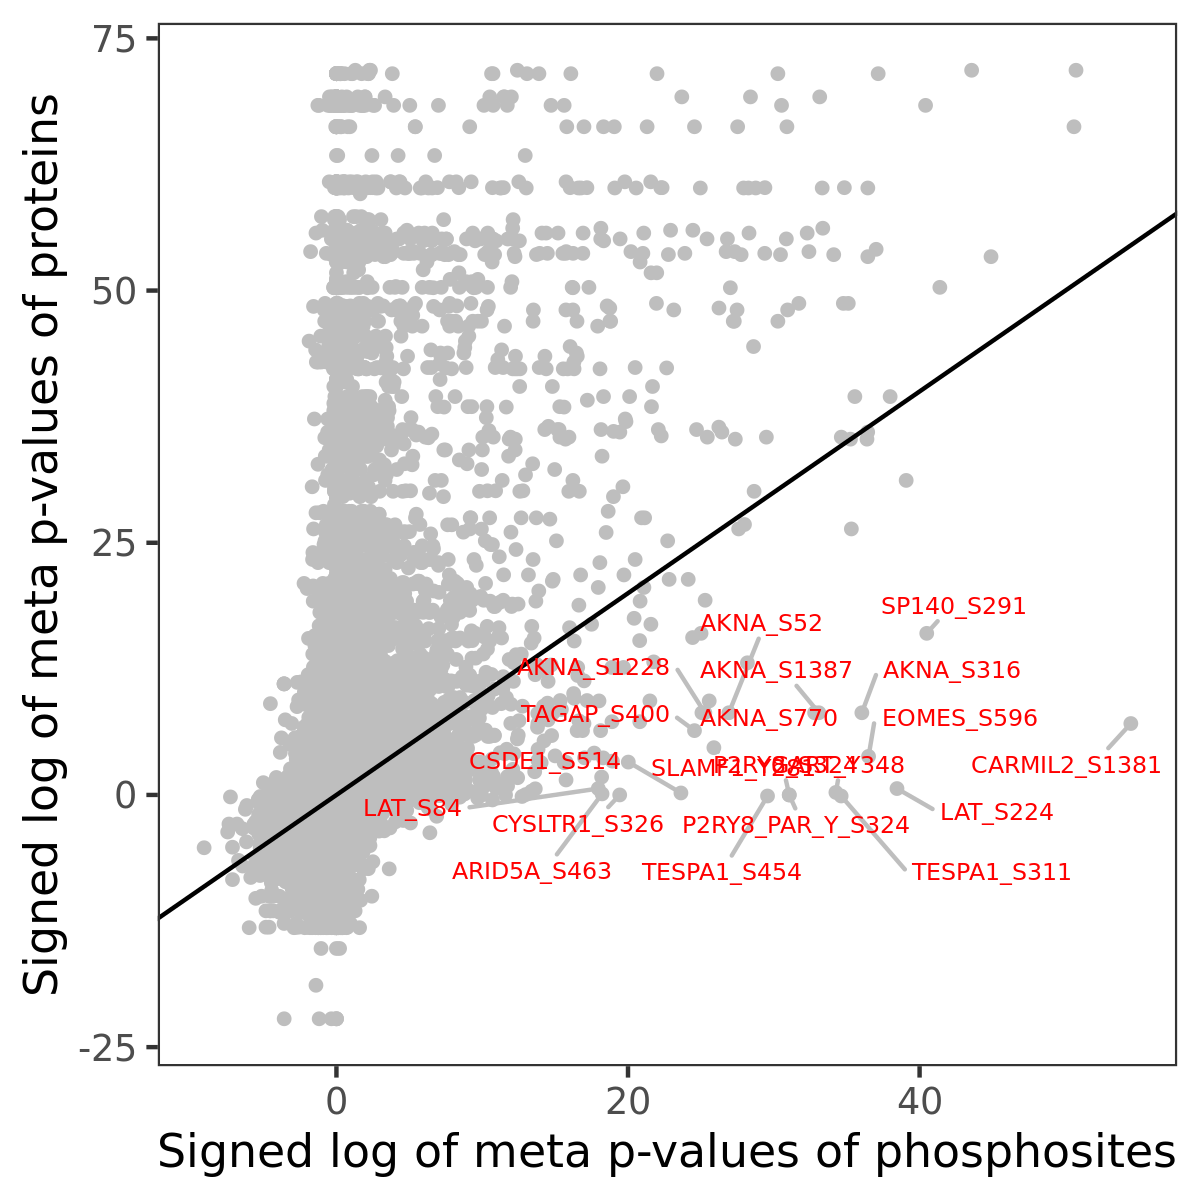
Phosphosite association
Number of significant genes with P-value ≤ 10-6 for each cohorts are summarized in the bar plot. The scatter plot highlights significant associations diven by phosphorylation rather than protein abundance.
| Signed p-values | |||||||||||||
|---|---|---|---|---|---|---|---|---|---|---|---|---|---|
| Gene | Protein | Site | Meta P | BRCA | CCRCC | COAD | GBM | HNSCC | LSCC | LUAD | OV | PDAC | UCEC |
Gene set enrichment analysis
Submit phosphorylation sites and the common logarithm of the p-values of their association with xcell: T cell CD4+ memory to WebGestalt.