Basic information
- Phenotype
- KINASE-PSP_Chk1/CHEK1
- Description
- Enrichment score representing kinase activity of Chk1. The score was calculated using PTM-SEA on the phosphoproteomics data.
- Source
- https://proteomics.broadapps.org/ptmsigdb/
- Method
- Phosphosite signature scores were calculated using the PTMsigDB v1.9.0 database and the ssGSEA2.0 R package (PMID: 30563849). The parameters were the same as those used for Hallmark pathway activity (sample.norm.type="rank", weight=0.75, statistic="area.under.RES", nperm=1000, min.overlap=10). Phosphoproteomics data were filtered to the fifteenmer phosphosites with complete data across all samples within a cohort. If there were multiple rows with complete data for identical fifteenmers, one row was selected at random. Each site was z-score transformed. Activity scores are normalized enrichment scores from ssGSEA.
- Genes
-
- CAAP1 S203
- CAMSAP2 S464
- CCDC6 S240
- CCDC6 S244
- CDC25C S216
- CEP170B S655
- CLK3 S157
- CTR9 S1081
- CTTN S298
- CWC25 S337
- DDX24 S82
- EML3 S176
- ERRFI1 S251
- GOLGA4 S71
- LATS2 S408
- LIG1 S76
- LMO7 S1458
- MYCBP2 S3478
- OGT S20
- OSBPL11 S189
- PLRG1 S119
- POP4 S10
- PROSER2 S43
- PRR5 S240
- RBM14 S618
- RIF1 S2205
- SENP2 S344
- SEPTIN7 T228
- SETMAR S508
- SRRM2 S1497
- SRRM2 S1499
- TBC1D4 S588
- TFDP1 S23
- TNK1 S502
- TP53BP1 S1678
- TRIM28 S473
- More...
Gene association
Number of significant genes with P-value ≤ 10-6 for each cohorts are summarized in bar plots. The scatter plot highlights significant associations diven by protein rather than mRNA abundance.
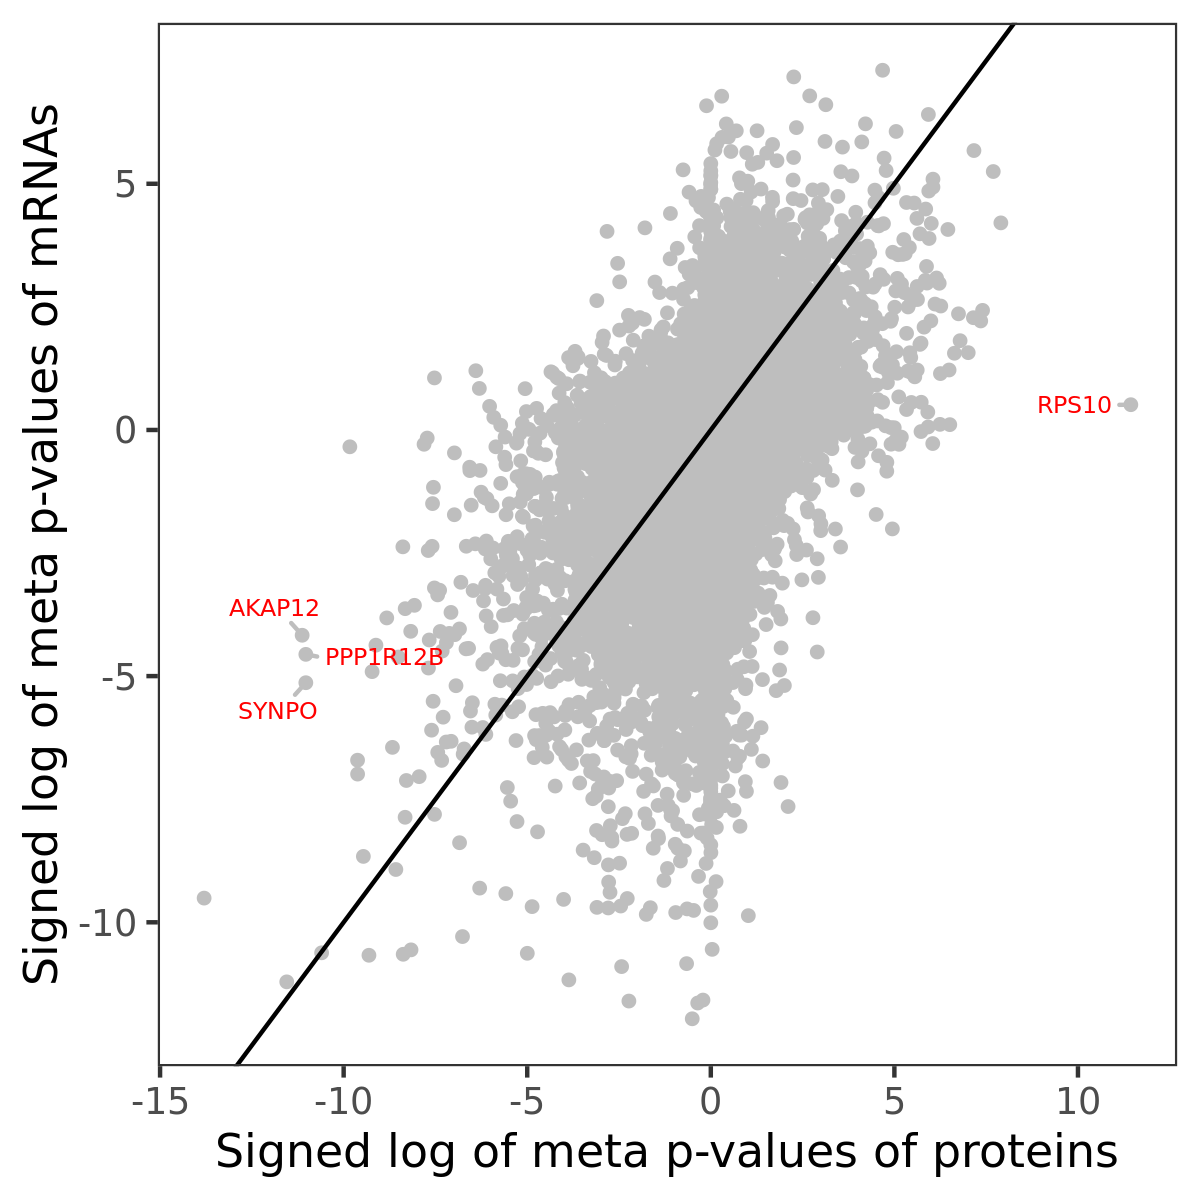
Association of protein abundance of genes
| Signed p-values | |||||||||||
|---|---|---|---|---|---|---|---|---|---|---|---|
| Gene | Meta P | BRCA | CCRCC | COAD | GBM | HNSCC | LSCC | LUAD | OV | PDAC | UCEC |
Gene set enrichment analysis
Submit genes and the common logarithm of the p-values of their association with KINASE-PSP_Chk1/CHEK1 to WebGestalt.
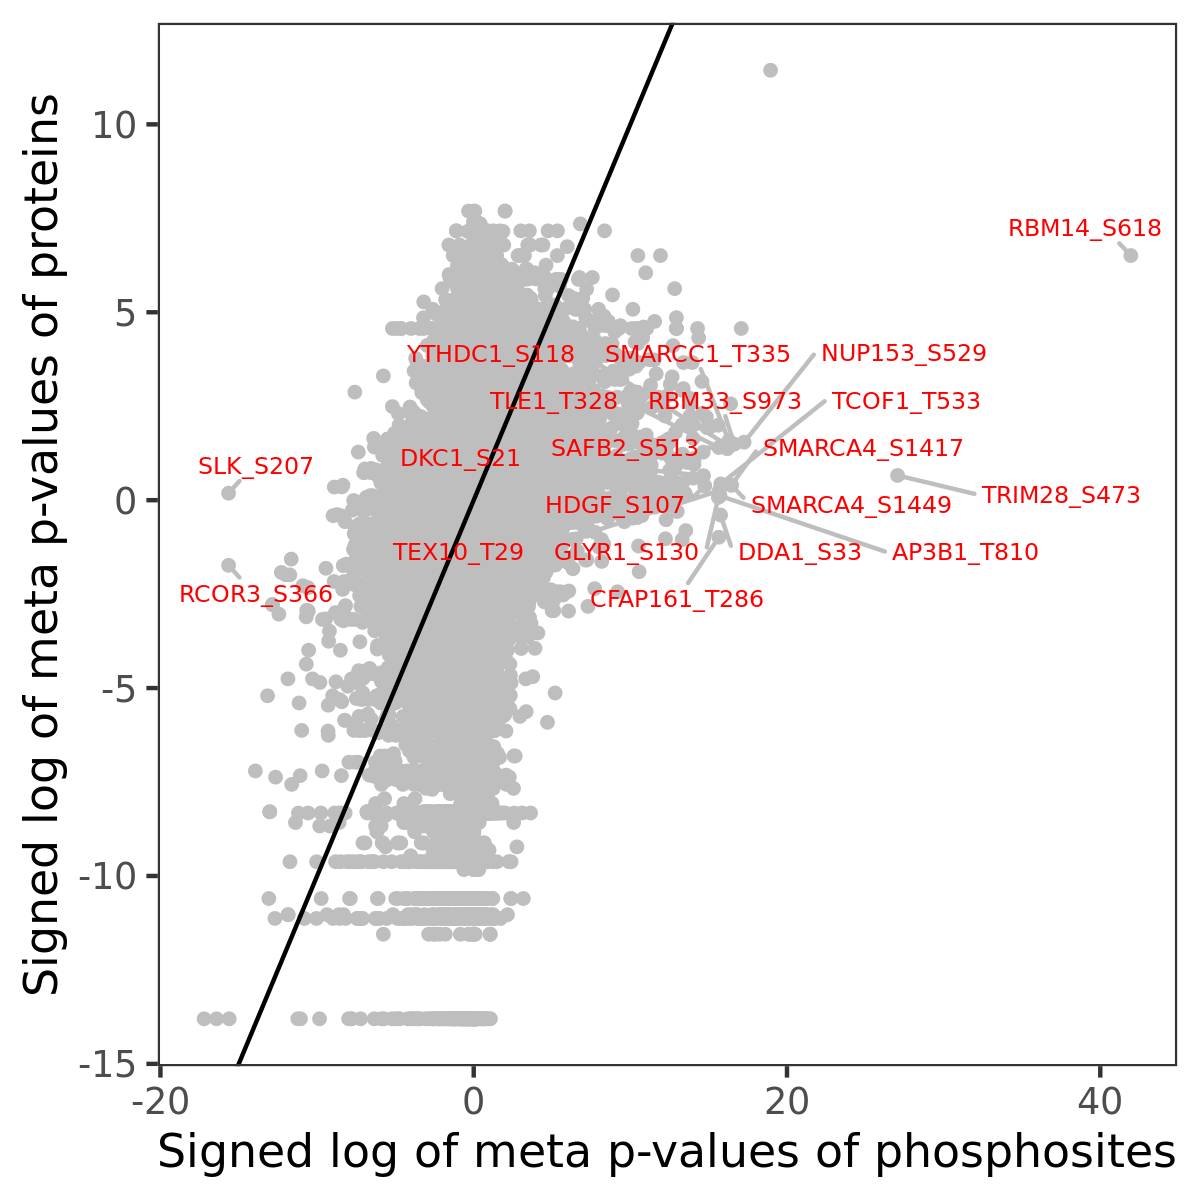
Phosphosite association
Number of significant genes with P-value ≤ 10-6 for each cohorts are summarized in the bar plot. The scatter plot highlights significant associations diven by phosphorylation rather than protein abundance.
| Signed p-values | |||||||||||||
|---|---|---|---|---|---|---|---|---|---|---|---|---|---|
| Gene | Protein | Site | Meta P | BRCA | CCRCC | COAD | GBM | HNSCC | LSCC | LUAD | OV | PDAC | UCEC |
Gene set enrichment analysis
Submit phosphorylation sites and the common logarithm of the p-values of their association with KINASE-PSP_Chk1/CHEK1 to WebGestalt.