Basic information
- Phenotype
- HALLMARK_ALLOGRAFT_REJECTION
- Description
- Enrichment score representing genes increased during transplant rejection. The score was calculated using ssGSEA on the RNA data (Z-score transformed coding genes with expression in at least 50% of the samples in a cohort).
- Source
- http://www.gsea-msigdb.org/gsea/msigdb/cards/HALLMARK_ALLOGRAFT_REJECTION.html
- Method
- Single sample gene set enrichment analysis (ssGSEA) was performed for each cancer type using gene-wise Z-scores of the RNA expression data (RSEM) for the MSigDB Hallmark gene sets v7.0 (PMID: 26771021) via the ssGSEA2.0 R package (PMID: 30563849). RNA data were filtered to coding genes with < 50% 0 expression. (Parameters: sample.norm.type="rank", weight=0.75, statistic="area.under.RES", nperm=1000, min.overlap=10). Pathway activity scores are normalized enrichment scores from ssGSEA.
- Genes
-
- ABCE1
- ABI1
- ACHE
- ACVR2A
- AKT1
- APBB1
- B2M
- BCAT1
- BCL10
- BCL3
- BRCA1
- C2
- CAPG
- CARTPT
- CCL11
- CCL13
- CCL19
- CCL2
- CCL22
- CCL4
- CCL5
- CCL7
- CCND2
- CCND3
- CCR1
- CCR2
- CCR5
- CD1D
- CD2
- CD247
- CD28
- CD3D
- CD3E
- CD3G
- CD4
- CD40
- CD40LG
- CD47
- CD7
- CD74
- CD79A
- CD80
- CD86
- CD8A
- CD8B
- CD96
- CDKN2A
- CFP
- CRTAM
- CSF1
- CSK
- CTSS
- CXCL13
- CXCL9
- CXCR3
- DARS1
- DEGS1
- DYRK3
- EGFR
- EIF3A
- EIF3D
- EIF3J
- EIF4G3
- EIF5A
- ELANE
- ELF4
- EREG
- ETS1
- F2
- F2R
- FAS
- FASLG
- FCGR2B
- FGR
- FLNA
- FYB1
- GALNT1
- GBP2
- GCNT1
- GLMN
- GPR65
- GZMA
- GZMB
- HCLS1
- HDAC9
- HIF1A
- HLA-A
- HLA-DMA
- HLA-DMB
- HLA-DOA
- HLA-DOB
- HLA-DQA1
- HLA-DRA
- HLA-E
- HLA-G
- ICAM1
- ICOSLG
- IFNAR2
- IFNG
- IFNGR1
- IFNGR2
- IGSF6
- IKBKB
- IL10
- IL11
- IL12A
- IL12B
- IL12RB1
- IL13
- IL15
- IL16
- IL18
- IL18RAP
- IL1B
- IL2
- IL27RA
- IL2RA
- IL2RB
- IL2RG
- IL4
- IL4R
- IL6
- IL7
- IL9
- INHBA
- INHBB
- IRF4
- IRF7
- IRF8
- ITGAL
- ITGB2
- ITK
- JAK2
- KLRD1
- KRT1
- LCK
- LCP2
- LIF
- LTB
- LY75
- LY86
- LYN
- MAP3K7
- MAP4K1
- MBL2
- MMP9
- MRPL3
- MTIF2
- NCF4
- NCK1
- NCR1
- NLRP3
- NME1
- NOS2
- NPM1
- PF4
- PRF1
- PRKCB
- PRKCG
- PSMB10
- PTPN6
- PTPRC
- RARS1
- RIPK2
- RPL39
- RPL3L
- RPL9
- RPS19
- RPS3A
- RPS9
- SIT1
- SOCS1
- SOCS5
- SPI1
- SRGN
- ST8SIA4
- STAB1
- STAT1
- STAT4
- TAP1
- TAP2
- TAPBP
- TGFB1
- TGFB2
- THY1
- TIMP1
- TLR1
- TLR2
- TLR3
- TLR6
- TNF
- TPD52
- TRAF2
- TRAT1
- UBE2D1
- UBE2N
- WARS1
- WAS
- ZAP70
- More...
Gene association
Number of significant genes with P-value ≤ 10-6 for each cohorts are summarized in bar plots. The scatter plot highlights significant associations diven by protein rather than mRNA abundance.
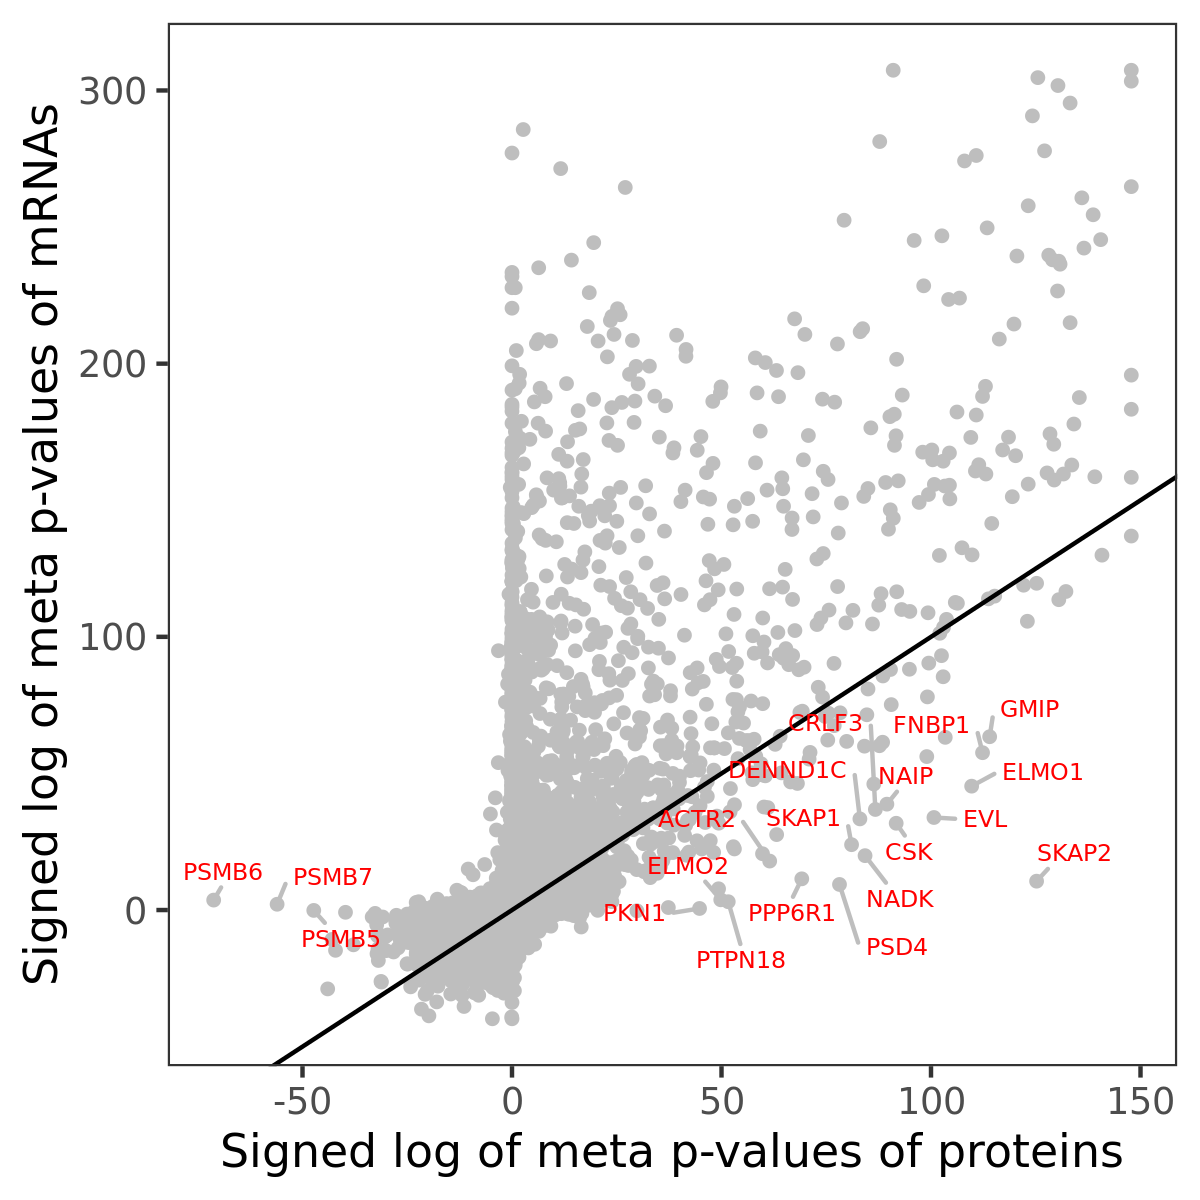
Association of protein abundance of genes
| Signed p-values | |||||||||||
|---|---|---|---|---|---|---|---|---|---|---|---|
| Gene | Meta P | BRCA | CCRCC | COAD | GBM | HNSCC | LSCC | LUAD | OV | PDAC | UCEC |
Gene set enrichment analysis
Submit genes and the common logarithm of the p-values of their association with HALLMARK_ALLOGRAFT_REJECTION to WebGestalt.
Phosphosite association
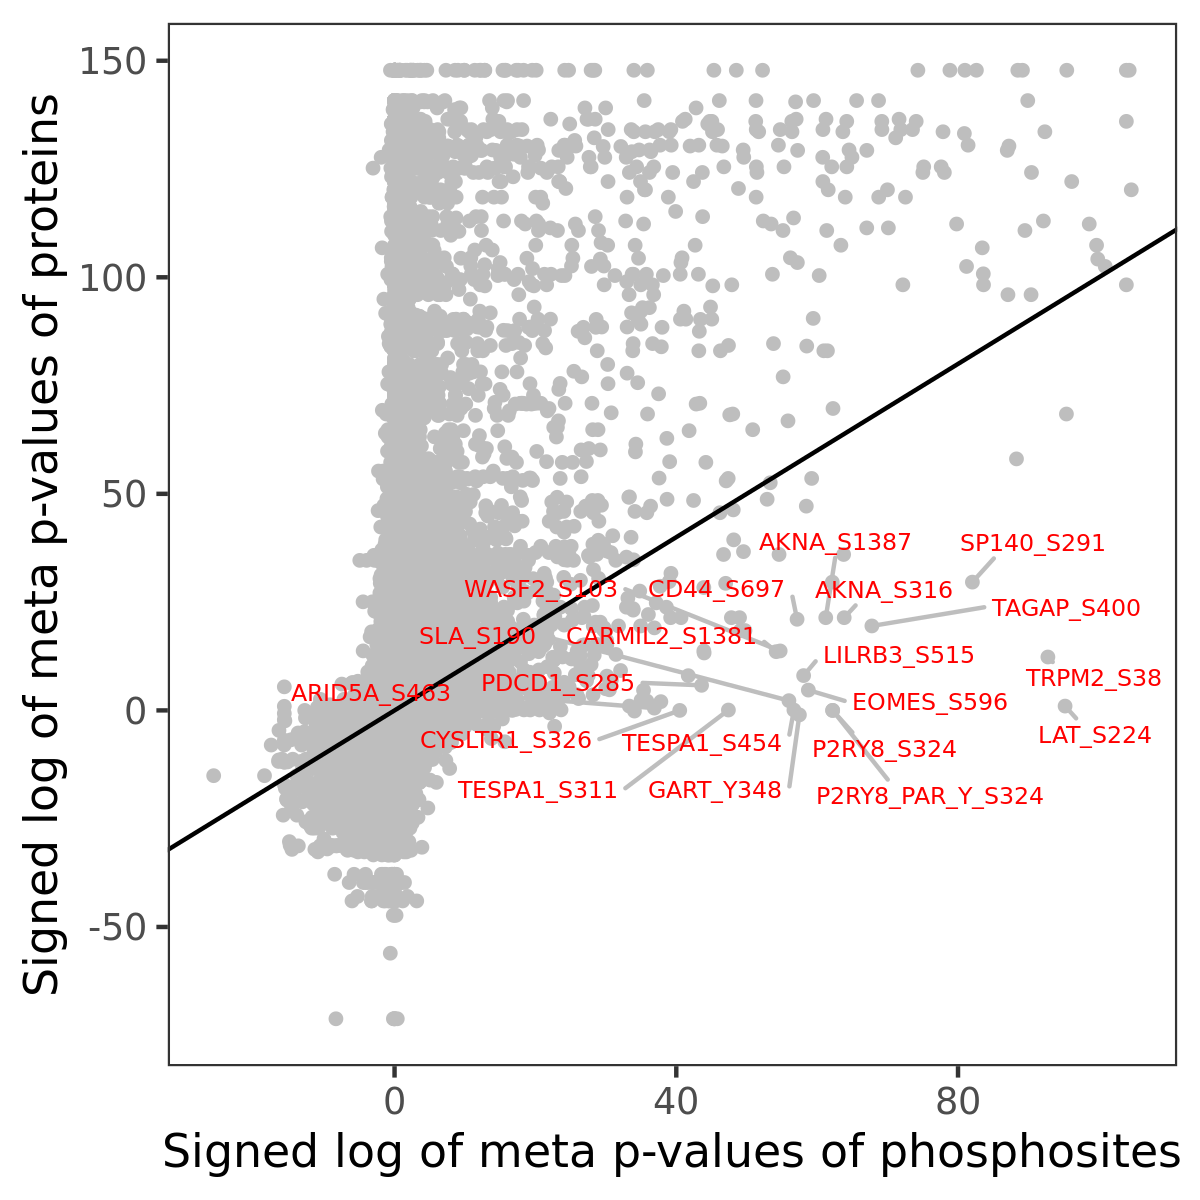
Number of significant genes with P-value ≤ 10-6 for each cohorts are summarized in the bar plot. The scatter plot highlights significant associations diven by phosphorylation rather than protein abundance.
| Signed p-values | |||||||||||||
|---|---|---|---|---|---|---|---|---|---|---|---|---|---|
| Gene | Protein | Site | Meta P | BRCA | CCRCC | COAD | GBM | HNSCC | LSCC | LUAD | OV | PDAC | UCEC |
Gene set enrichment analysis
Submit phosphorylation sites and the common logarithm of the p-values of their association with HALLMARK_ALLOGRAFT_REJECTION to WebGestalt.