Basic information
- Phenotype
- KINASE-PSP_AurB/AURKB
- Description
- Enrichment score representing kinase activity of Aurora B. The score was calculated using PTM-SEA on the phosphoproteomics data.
- Source
- https://proteomics.broadapps.org/ptmsigdb/
- Method
- Phosphosite signature scores were calculated using the PTMsigDB v1.9.0 database and the ssGSEA2.0 R package (PMID: 30563849). The parameters were the same as those used for Hallmark pathway activity (sample.norm.type="rank", weight=0.75, statistic="area.under.RES", nperm=1000, min.overlap=10). Phosphoproteomics data were filtered to the fifteenmer phosphosites with complete data across all samples within a cohort. If there were multiple rows with complete data for identical fifteenmers, one row was selected at random. Each site was z-score transformed. Activity scores are normalized enrichment scores from ssGSEA.
- Genes
-
- CAVIN1 S300
- CDCA8 S219
- DDA1 S33
- DDX3X S594
- DDX3Y S592
- DDX52 S22
- GFAP S13
- GFAP S38
- GFAP T7
- HSP90AB1 S255
- KIF23 S911
- KNL1 S60
- LMO7 S248
- LMO7 S699
- MAPRE3 S176
- MISP S348
- MKI67 S538
- MKI67 S374
- NAGK S76
- NDC80 S5
- NELFE S131
- NUMA1 T2055
- NUMA1 S2047
- NUMA1 S1969
- PLEC T2886
- PPHLN1 S110
- RASSF1 S207
- RB1 S780
- RBM14 S618
- RBM3 S147
- RIF1 S2205
- RUNX3 T14
- SEPTIN1 S315
- SH2D4A S261
- SSH3 S37
- VIM S73
- More...
Gene association
Number of significant genes with P-value ≤ 10-6 for each cohorts are summarized in bar plots. The scatter plot highlights significant associations diven by protein rather than mRNA abundance.
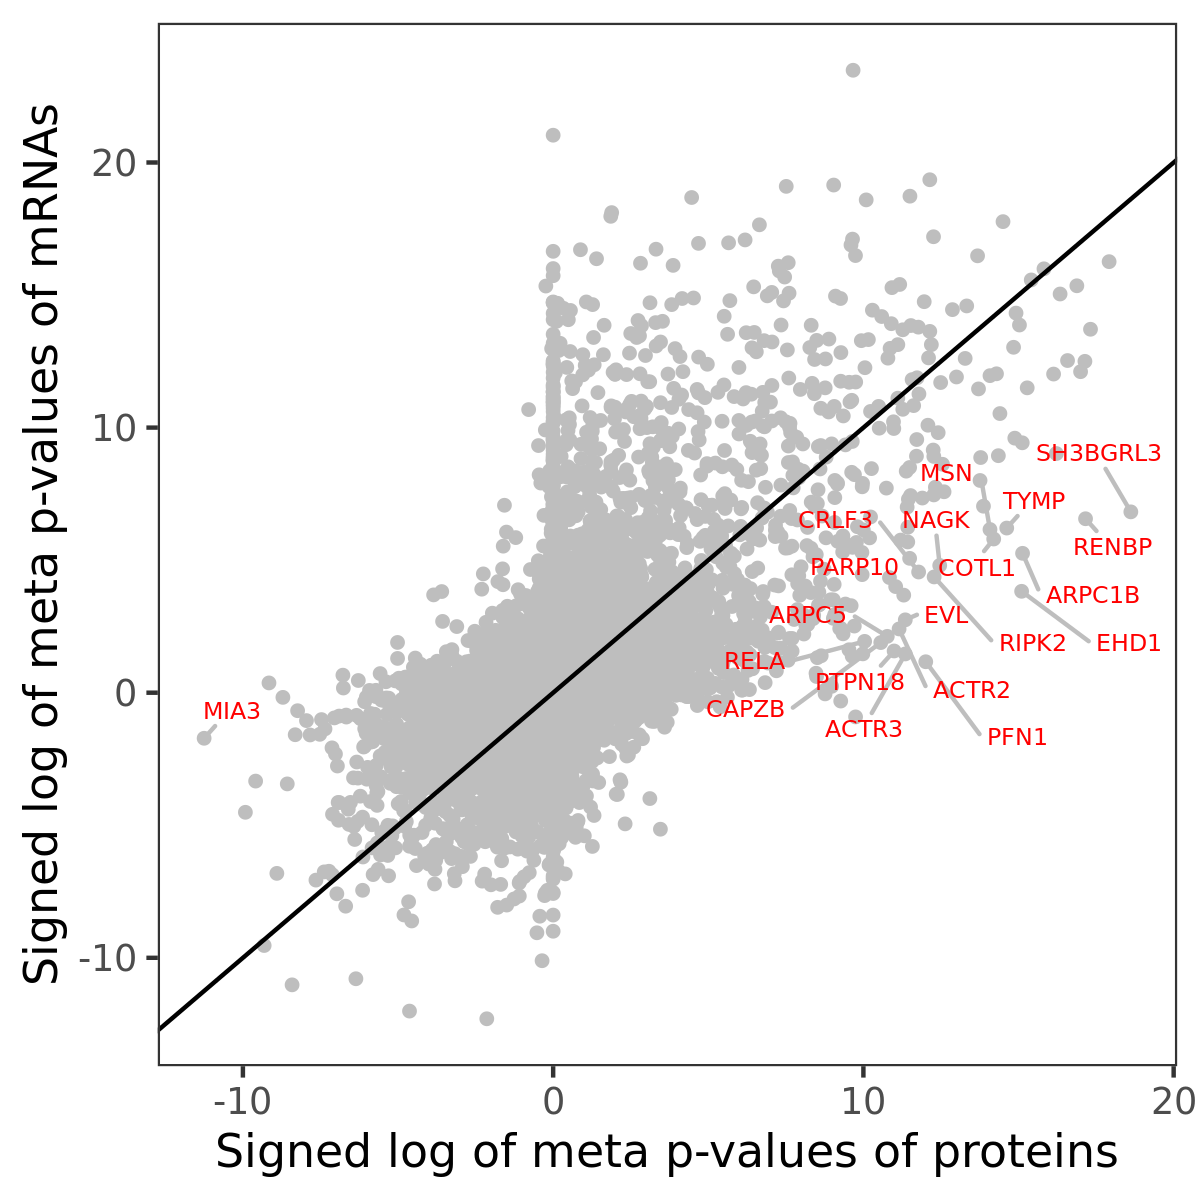
Association of protein abundance of genes
Signed p-values | ||||||||||||
|---|---|---|---|---|---|---|---|---|---|---|---|---|
Gene | Meta P | BRCA | CCRCC | COAD | GBM | HNSCC | LSCC | LUAD | OV | PDAC | UCEC | |
| No matching records found | ||||||||||||
Gene set enrichment analysis
Submit genes and the common logarithm of the p-values of their association with KINASE-PSP_AurB/AURKB to WebGestalt.
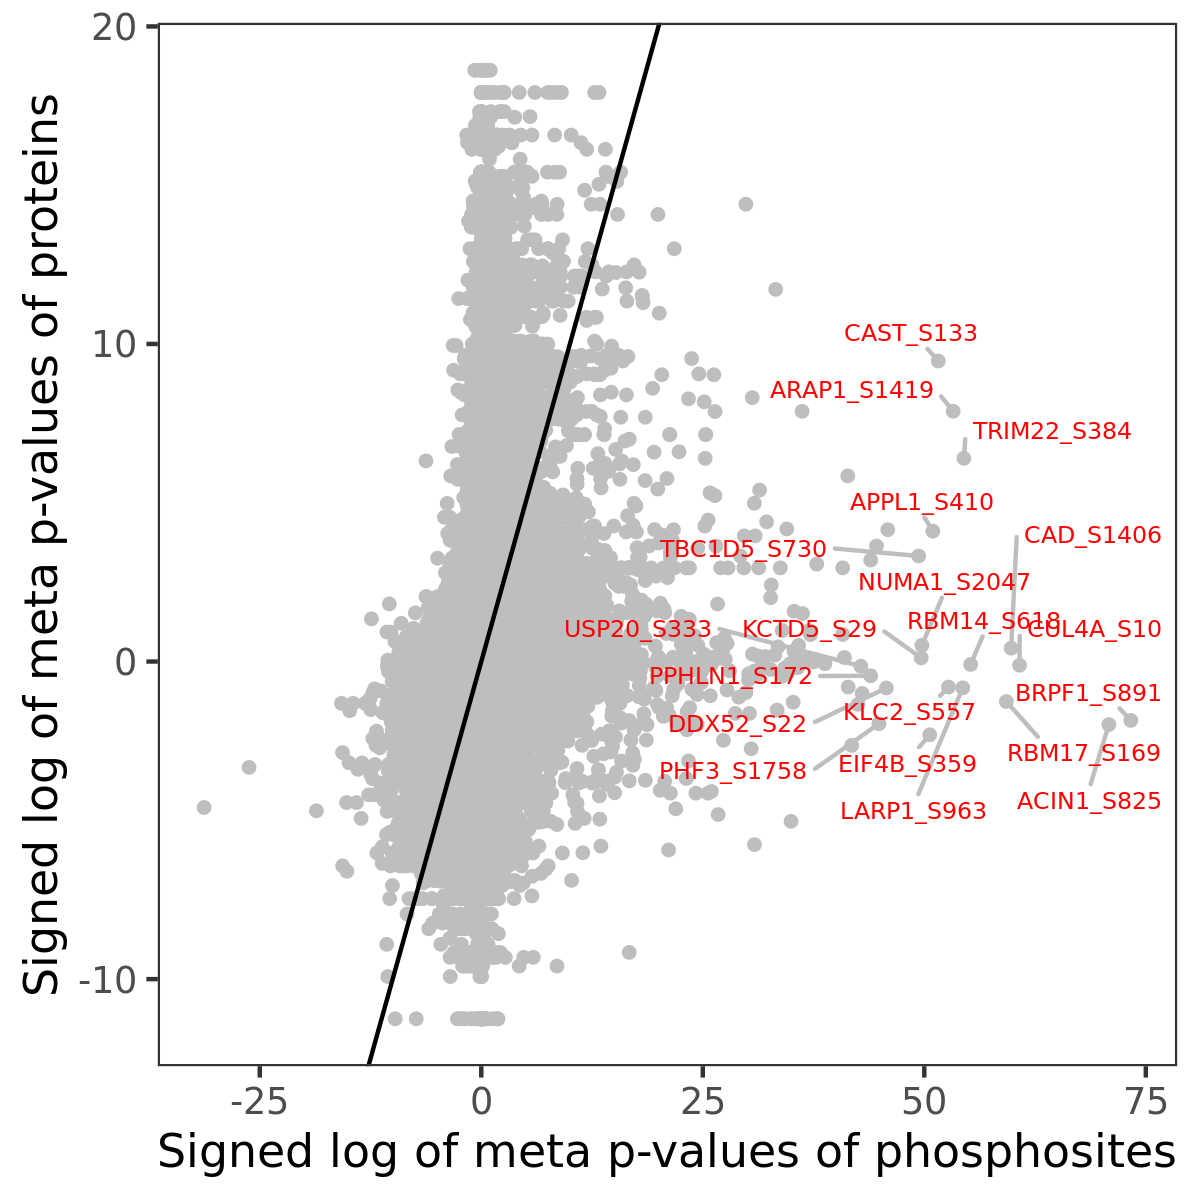
Phosphosite association
Number of significant genes with P-value ≤ 10-6 for each cohorts are summarized in the bar plot. The scatter plot highlights significant associations diven by phosphorylation rather than protein abundance.
Signed p-values | |||||||||||||
|---|---|---|---|---|---|---|---|---|---|---|---|---|---|
Gene | Protein | Site | Meta P | BRCA | CCRCC | COAD | GBM | HNSCC | LSCC | LUAD | OV | PDAC | UCEC |
| No matching records found | |||||||||||||
Gene set enrichment analysis
Submit phosphorylation sites and the common logarithm of the p-values of their association with KINASE-PSP_AurB/AURKB to WebGestalt.