Basic information
- Phenotype
- PERT-PSP_PHORBOL_ESTER
- Description
- Enrichment score representing phosphorylation alterations in response to phorbol ester. The score was calculated using PTM-SEA on the phosphoproteomics data.
- Source
- https://proteomics.broadapps.org/ptmsigdb/
- Method
- Phosphosite signature scores were calculated using the PTMsigDB v1.9.0 database and the ssGSEA2.0 R package (PMID: 30563849). The parameters were the same as those used for Hallmark pathway activity (sample.norm.type="rank", weight=0.75, statistic="area.under.RES", nperm=1000, min.overlap=10). Phosphoproteomics data were filtered to the fifteenmer phosphosites with complete data across all samples within a cohort. If there were multiple rows with complete data for identical fifteenmers, one row was selected at random. Each site was z-score transformed. Activity scores are normalized enrichment scores from ssGSEA.
- Genes
-
- CALD1 S789
- CD44 S706
- EGFR T693
- EIF4G1 S1231
- FXYD1 S83
- GJA1 S279
- GSK3B S9
- IQGAP1 S1443
- ITGB4 S1364
- LCP1 S5
- MAPK1 Y187
- MAPK14 Y182
- MAPK14 T180
- MAPK3 Y204
- NCF1 S320
- NCF1 S345
- PDE3A S428
- PRKCD S645
- PRKCD Y313
- PRKCD T507
- PRKD2 S710
- PRKD2 S876
- RAF1 S43
- RPS6 S235
- RPS6 S236
- RPS6 S240
- RPS6KA1 S380
- RPS6KA3 S386
- RPS6KA3 S369
- RPS6KA3 T365
- RPS6KB1 S447
- RPS6KB1 T444
- RPTOR S863
- STAT3 S727
- STMN1 S25
- STMN1 S38
- TSC2 S664
- More...
Gene association
Number of significant genes with P-value ≤ 10-6 for each cohorts are summarized in bar plots. The scatter plot highlights significant associations diven by protein rather than mRNA abundance.
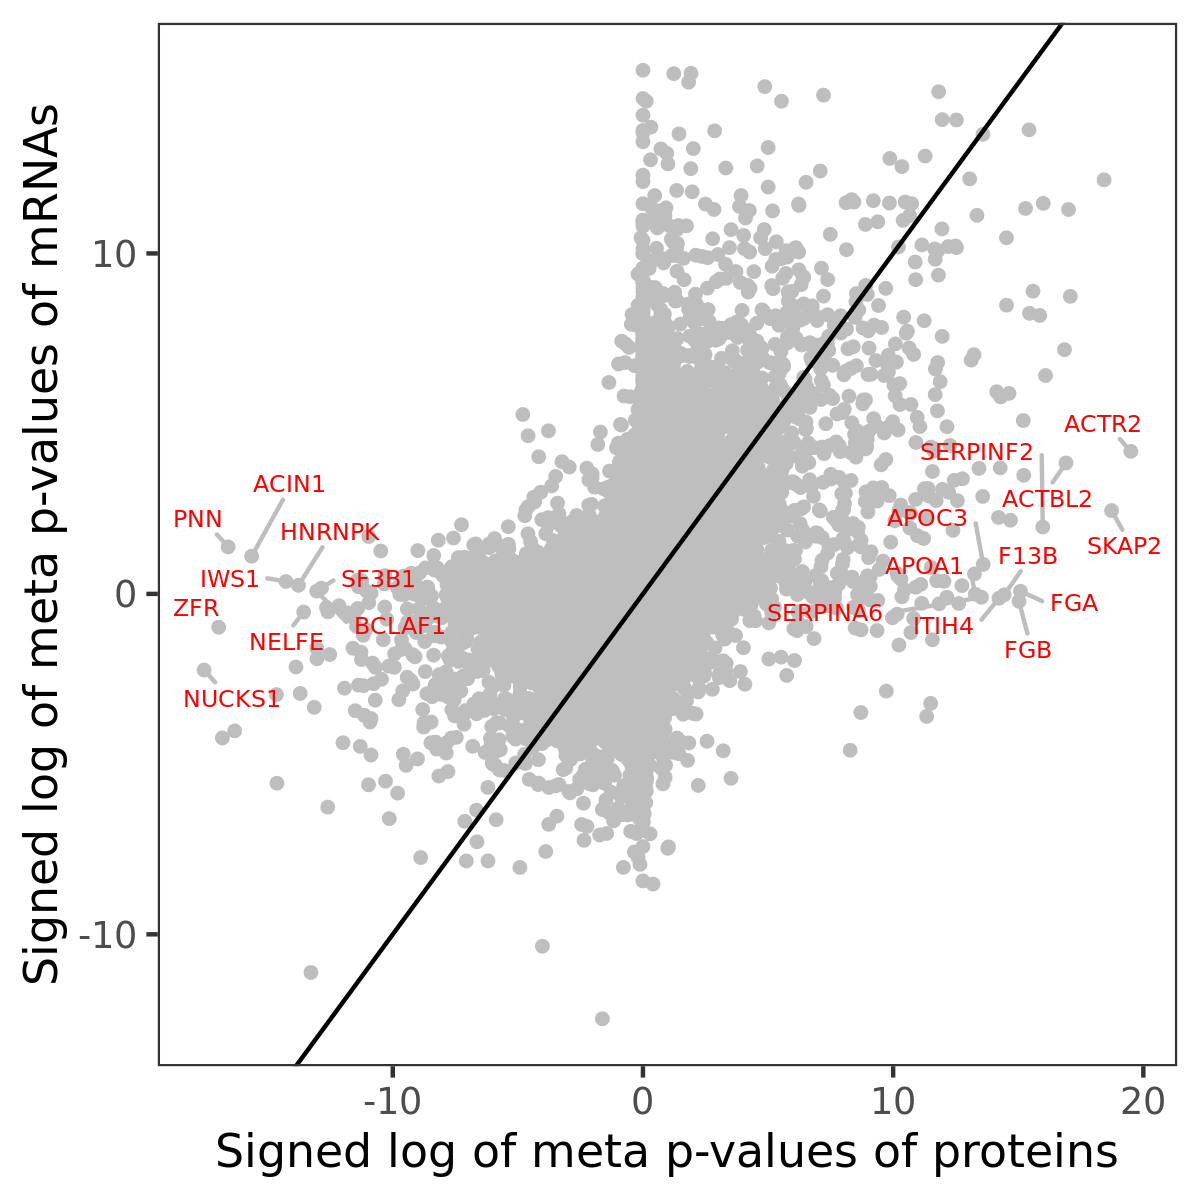
Association of protein abundance of genes
| Signed p-values | |||||||||||
|---|---|---|---|---|---|---|---|---|---|---|---|
| Gene | Meta P | BRCA | CCRCC | COAD | GBM | HNSCC | LSCC | LUAD | OV | PDAC | UCEC |
Gene set enrichment analysis
Submit genes and the common logarithm of the p-values of their association with PERT-PSP_PHORBOL_ESTER to WebGestalt.
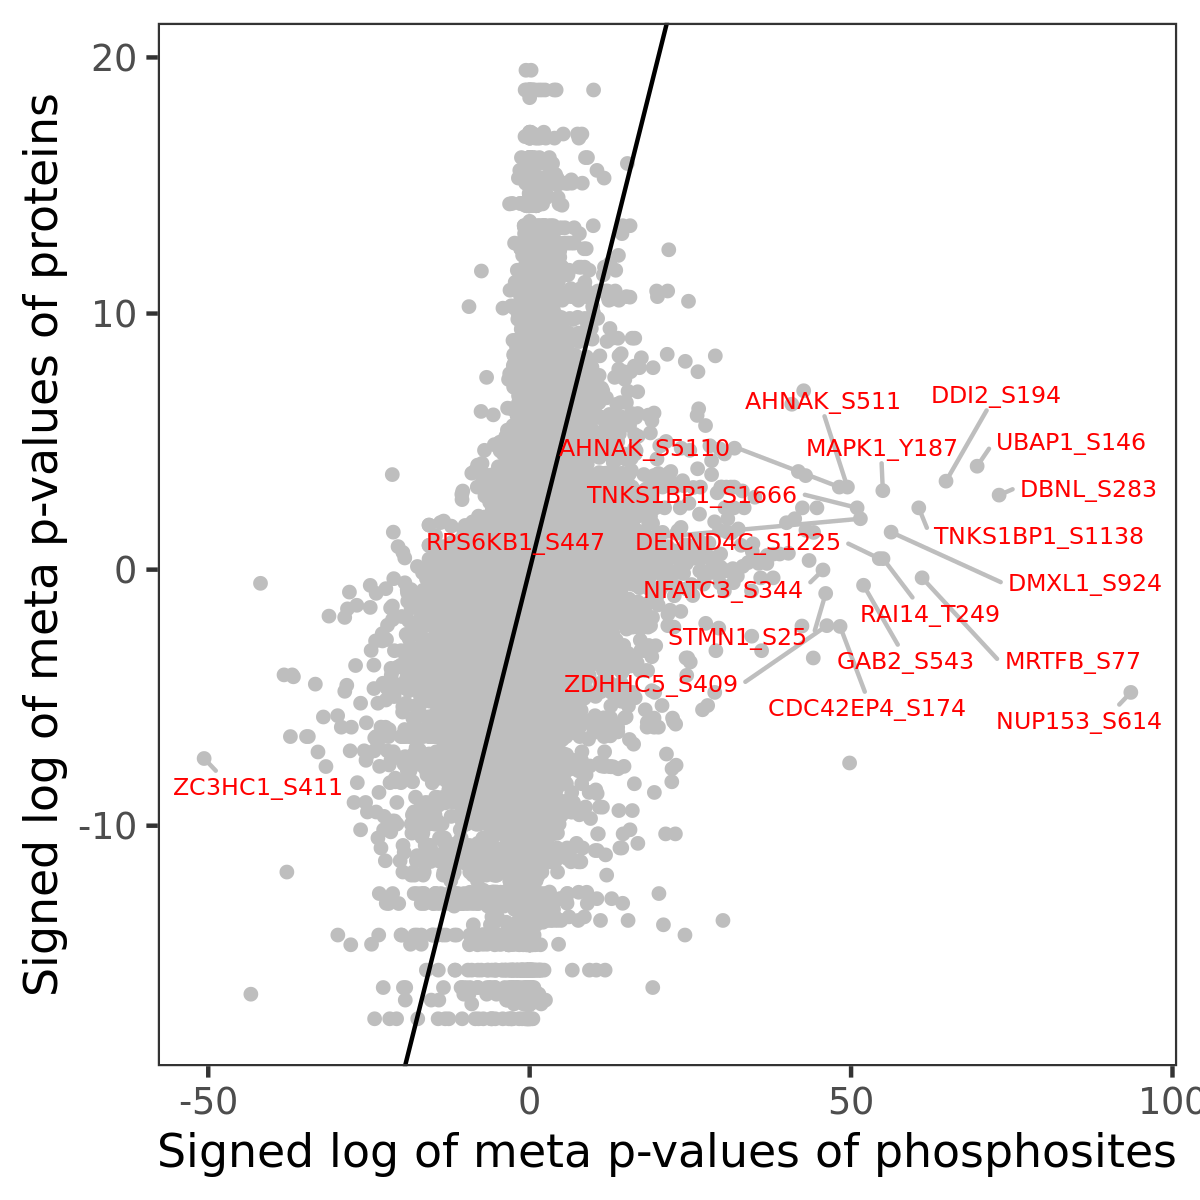
Phosphosite association
Number of significant genes with P-value ≤ 10-6 for each cohorts are summarized in the bar plot. The scatter plot highlights significant associations diven by phosphorylation rather than protein abundance.
| Signed p-values | |||||||||||||
|---|---|---|---|---|---|---|---|---|---|---|---|---|---|
| Gene | Protein | Site | Meta P | BRCA | CCRCC | COAD | GBM | HNSCC | LSCC | LUAD | OV | PDAC | UCEC |
Gene set enrichment analysis
Submit phosphorylation sites and the common logarithm of the p-values of their association with PERT-PSP_PHORBOL_ESTER to WebGestalt.