Basic information
- Phenotype
- HALLMARK_COMPLEMENT
- Description
- Enrichment score representing genes involved in the complement system. The score was calculated using ssGSEA on the RNA data (Z-score transformed coding genes with expression in at least 50% of the samples in a cohort).
- Source
- http://www.gsea-msigdb.org/gsea/msigdb/cards/HALLMARK_COMPLEMENT.html
- Method
- Single sample gene set enrichment analysis (ssGSEA) was performed for each cancer type using gene-wise Z-scores of the RNA expression data (RSEM) for the MSigDB Hallmark gene sets v7.0 (PMID: 26771021) via the ssGSEA2.0 R package (PMID: 30563849). RNA data were filtered to coding genes with < 50% 0 expression. (Parameters: sample.norm.type="rank", weight=0.75, statistic="area.under.RES", nperm=1000, min.overlap=10). Pathway activity scores are normalized enrichment scores from ssGSEA.
- Genes
-
- ADAM9
- ADRA2B
- AKAP10
- ANG
- ANXA5
- APOA4
- APOBEC3F
- APOBEC3G
- APOC1
- ATOX1
- BRPF3
- C1QA
- C1QC
- C1R
- C1S
- C2
- C3
- C4BPB
- C9
- CA2
- CALM1
- CALM3
- CASP1
- CASP10
- CASP3
- CASP4
- CASP5
- CASP7
- CASP9
- CBLB
- CCL5
- CD36
- CD40LG
- CD46
- CD55
- CD59
- CDA
- CDH13
- CDK5R1
- CEBPB
- CFB
- CFH
- CLU
- COL4A2
- CP
- CPM
- CPQ
- CR1
- CR2
- CSRP1
- CTSB
- Array
- CTSC
- CTSD
- CTSH
- CTSL
- CTSO
- CTSS
- CTSV
- CXCL1
- DGKG
- DGKH
- DOCK10
- DOCK4
- DOCK9
- DPP4
- DUSP5
- DUSP6
- DYRK2
- EHD1
- ERAP2
- F10
- F2
- F3
- F5
- F7
- F8
- FCER1G
- FCN1
- FDX1
- FN1
- FYN
- GATA3
- GCA
- GMFB
- GNAI2
- GNAI3
- GNB2
- GNB4
- GNG2
- GNGT2
- GP1BA
- GP9
- GPD2
- GRB2
- GZMA
- GZMB
- GZMK
- HNF4A
- HPCAL4
- HSPA1A
- HSPA5
- IL6
- IRF1
- IRF2
- IRF7
- ITGAM
- ITIH1
- JAK2
- KCNIP2
- KCNIP3
- KIF2A
- KLK1
- KLKB1
- KYNU
- L3MBTL4
- LAMP2
- LAP3
- LCK
- LCP2
- LGALS3
- LGMN
- LIPA
- LRP1
- LTA4H
- LTF
- LYN
- MAFF
- ME1
- MMP12
- MMP13
- MMP14
- MMP15
- MMP8
- MSRB1
- MT3
- NOTCH4
- OLR1
- PCLO
- PCSK9
- PDGFB
- PDP1
- PFN1
- PHEX
- PIK3CA
- PIK3CG
- PIK3R5
- PIM1
- PLA2G4A
- PLA2G7
- PLAT
- PLAUR
- PLEK
- PLG
- PLSCR1
- PPP2CB
- PPP4C
- PRCP
- PRDM4
- PREP
- PRKCD
- PRSS3
- PRSS36
- PSEN1
- PSMB9
- RABIF
- RAF1
- RASGRP1
- RBSN
- RCE1
- RHOG
- RNF4
- S100A12
- S100A13
- S100A9
- SCG3
- SERPINA1
- SERPINB2
- SERPINC1
- SERPINE1
- SERPING1
- SH2B3
- SPOCK2
- SRC
- STX4
- TFPI2
- TIMP1
- TIMP2
- TMPRSS6
- TNFAIP3
- USP14
- USP15
- USP16
- USP8
- VCPIP1
- WAS
- XPNPEP1
- ZEB1
- ZFPM2
- More...
Gene association
Number of significant genes with P-value ≤ 10-6 for each cohorts are summarized in bar plots. The scatter plot highlights significant associations diven by protein rather than mRNA abundance.
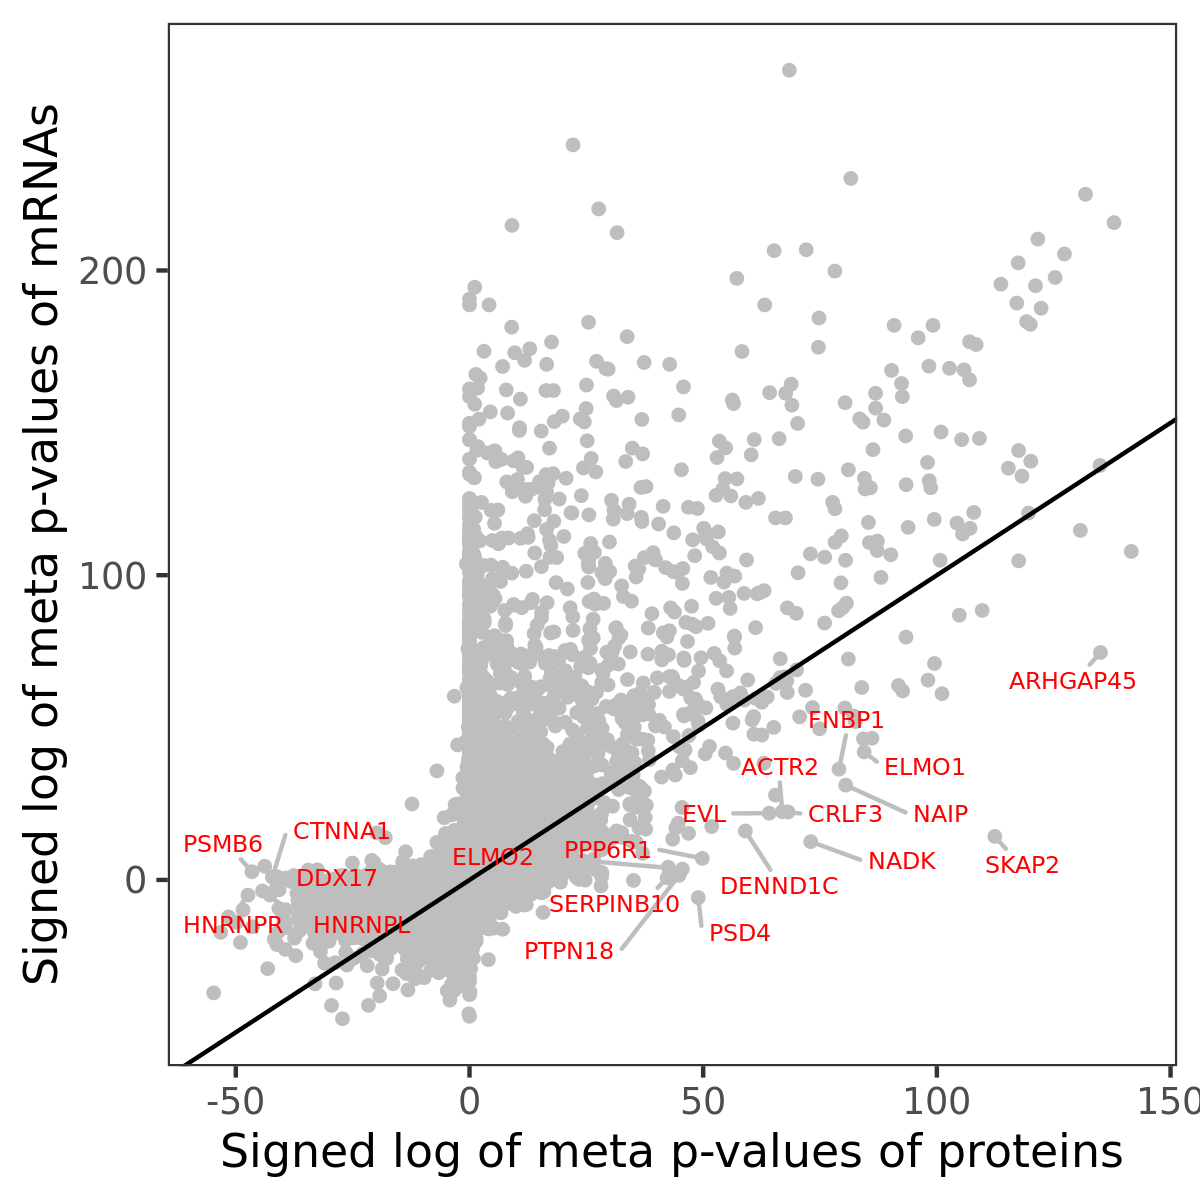
Association of protein abundance of genes
| Signed p-values | |||||||||||
|---|---|---|---|---|---|---|---|---|---|---|---|
| Gene | Meta P | BRCA | CCRCC | COAD | GBM | HNSCC | LSCC | LUAD | OV | PDAC | UCEC |
Gene set enrichment analysis
Submit genes and the common logarithm of the p-values of their association with HALLMARK_COMPLEMENT to WebGestalt.
Phosphosite association
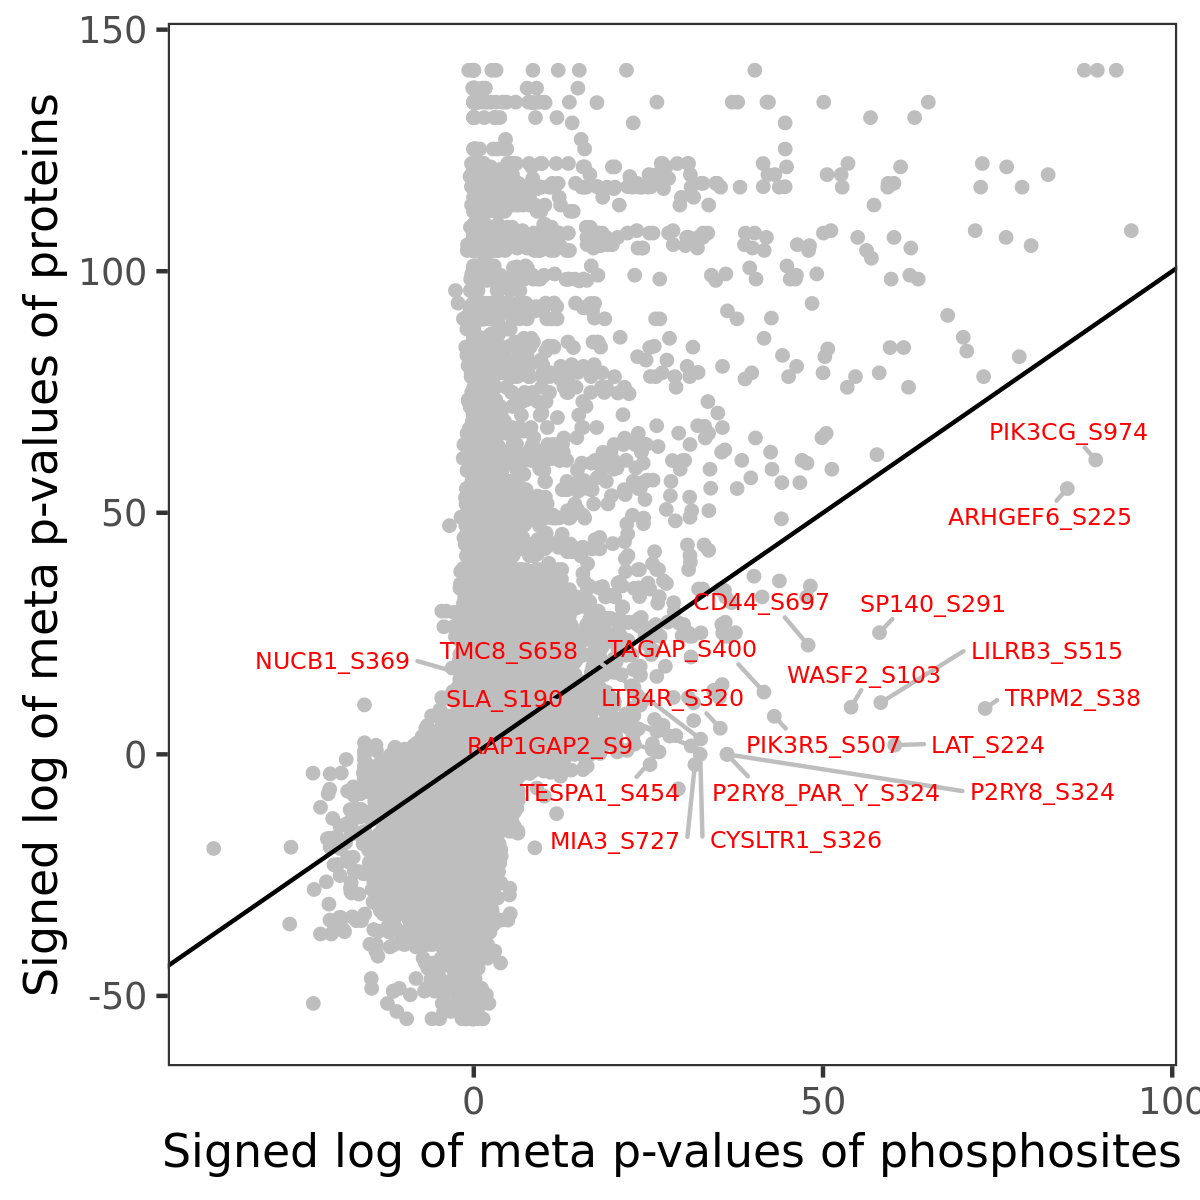
Number of significant genes with P-value ≤ 10-6 for each cohorts are summarized in the bar plot. The scatter plot highlights significant associations diven by phosphorylation rather than protein abundance.
| Signed p-values | |||||||||||||
|---|---|---|---|---|---|---|---|---|---|---|---|---|---|
| Gene | Protein | Site | Meta P | BRCA | CCRCC | COAD | GBM | HNSCC | LSCC | LUAD | OV | PDAC | UCEC |
Gene set enrichment analysis
Submit phosphorylation sites and the common logarithm of the p-values of their association with HALLMARK_COMPLEMENT to WebGestalt.