Basic information
- Phenotype
- KINASE-PSP_Akt1/AKT1
- Description
- Enrichment score representing kinase activity of AKT1. The score was calculated using PTM-SEA on the phosphoproteomics data.
- Source
- https://proteomics.broadapps.org/ptmsigdb/
- Method
- Phosphosite signature scores were calculated using the PTMsigDB v1.9.0 database and the ssGSEA2.0 R package (PMID: 30563849). The parameters were the same as those used for Hallmark pathway activity (sample.norm.type="rank", weight=0.75, statistic="area.under.RES", nperm=1000, min.overlap=10). Phosphoproteomics data were filtered to the fifteenmer phosphosites with complete data across all samples within a cohort. If there were multiple rows with complete data for identical fifteenmers, one row was selected at random. Each site was z-score transformed. Activity scores are normalized enrichment scores from ssGSEA.
- Genes
-
- ARHGAP22 S16
- ATXN1 S775
- BAD S99
- BCL3 S41
- BRAF S365
- CBY1 S20
- CCDC88A S1417
- CCT2 S260
- CDKN1B S10
- CTNNB1 S552
- DNMT1 S143
- EDC3 S161
- FAF1 S582
- FLNA S2152
- FLNC S2233
- FOXO1 S256
- FOXO3 S253
- FOXO4 S197
- GSK3A S21
- GSK3B S9
- HJURP S486
- HSPB1 S82
- LMNA S404
- METTL1 S27
- NDRG2 S332
- NIBAN1 S602
- NR3C1 S134
- PDCD4 S457
- PEA15 S116
- PFKFB2 S483
- PFKFB2 S466
- PFKFB3 S461
- PIKFYVE S307
- PKM S202
- PKM S37
- PLCG1 S1248
- PPP1CA T320
- PRKAA1 S496
- PYGO2 S48
- RANBP3 S126
- RUNX2 S28
- SH3RF1 S304
- SLC7A11 S26
- SLC9A1 S796
- SLC9A1 S703
- TBC1D4 S318
- TBC1D4 S588
- TIAM1 S231
- VCP S352
- VIM S39
- WEE1 S642
- ZFP36L1 S92
- More...
Gene association
Number of significant genes with P-value ≤ 10-6 for each cohorts are summarized in bar plots. The scatter plot highlights significant associations diven by protein rather than mRNA abundance.
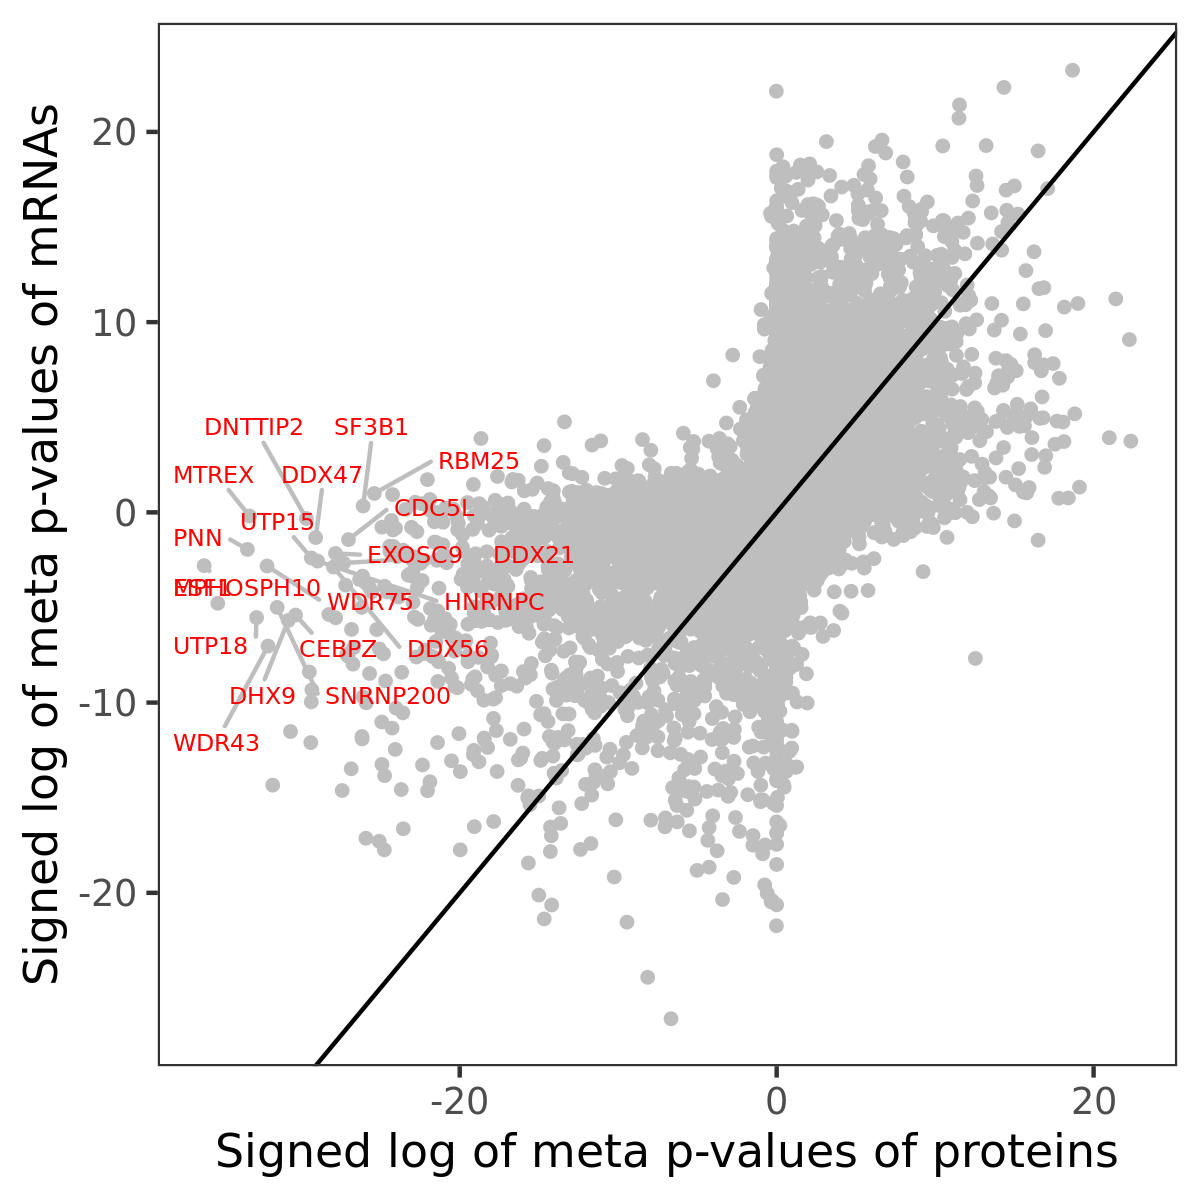
Association of protein abundance of genes
| Signed p-values | |||||||||||
|---|---|---|---|---|---|---|---|---|---|---|---|
| Gene | Meta P | BRCA | CCRCC | COAD | GBM | HNSCC | LSCC | LUAD | OV | PDAC | UCEC |
Gene set enrichment analysis
Submit genes and the common logarithm of the p-values of their association with KINASE-PSP_Akt1/AKT1 to WebGestalt.
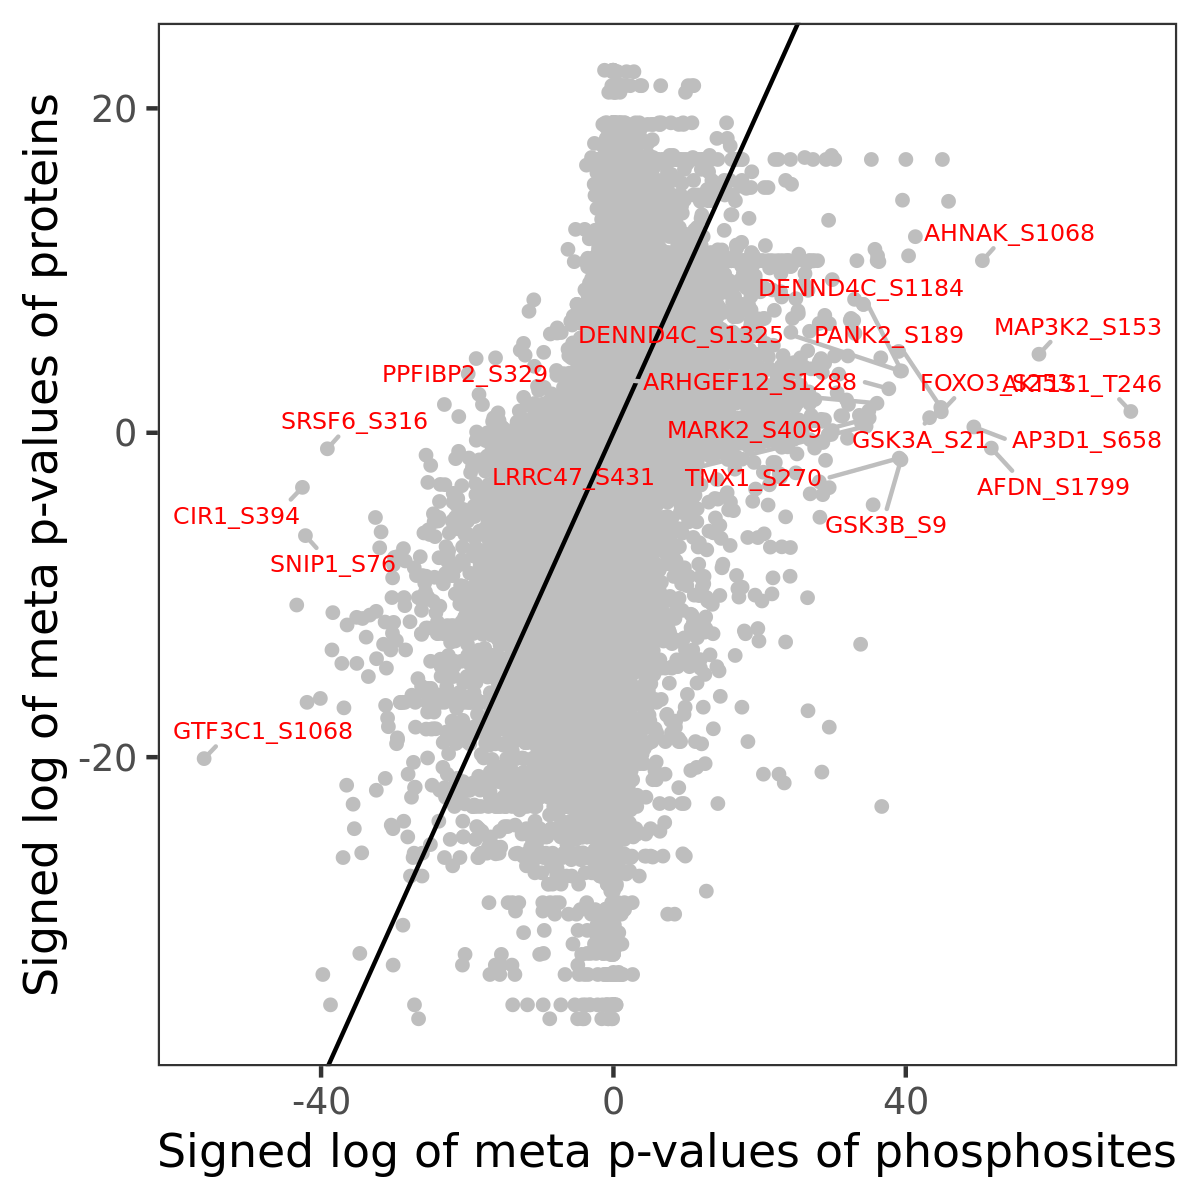
Phosphosite association
Number of significant genes with P-value ≤ 10-6 for each cohorts are summarized in the bar plot. The scatter plot highlights significant associations diven by phosphorylation rather than protein abundance.
| Signed p-values | |||||||||||||
|---|---|---|---|---|---|---|---|---|---|---|---|---|---|
| Gene | Protein | Site | Meta P | BRCA | CCRCC | COAD | GBM | HNSCC | LSCC | LUAD | OV | PDAC | UCEC |
Gene set enrichment analysis
Submit phosphorylation sites and the common logarithm of the p-values of their association with KINASE-PSP_Akt1/AKT1 to WebGestalt.