Basic information
- Phenotype
- KINASE-PSP_PKCA/PRKCA
- Description
- Enrichment score representing kinase activity of PKC alpha. The score was calculated using PTM-SEA on the phosphoproteomics data.
- Source
- https://proteomics.broadapps.org/ptmsigdb/
- Method
- Phosphosite signature scores were calculated using the PTMsigDB v1.9.0 database and the ssGSEA2.0 R package (PMID: 30563849). The parameters were the same as those used for Hallmark pathway activity (sample.norm.type="rank", weight=0.75, statistic="area.under.RES", nperm=1000, min.overlap=10). Phosphoproteomics data were filtered to the fifteenmer phosphosites with complete data across all samples within a cohort. If there were multiple rows with complete data for identical fifteenmers, one row was selected at random. Each site was z-score transformed. Activity scores are normalized enrichment scores from ssGSEA.
- Genes
-
- ANXA2 S12
- ARHGAP35 S1236
- ARHGDIA S34
- ATP5F1C S146
- BLVRA S230
- C5AR1 S332
- C5AR1 S327
- CFL1 S24
- CFTR S737
- CFTR S660
- CLDN4 S194
- CYBA T147
- EIF4G1 S1185
- F11R S284
- F3 S285
- FSCN1 S39
- GPSM2 S408
- GSK3A S21
- GSK3B S9
- IQGAP1 S1443
- ITGB4 S1364
- KIT S746
- KRT20 S13
- LRP1 T4460
- LRP1 S4520
- LRP1 S4523
- MARCKS S167
- MARCKS S170
- NCF1 S320
- PDE3A S312
- PDE3A S428
- PFKFB3 S461
- PLCB3 S1105
- PLCG1 S1248
- PPP1R1A S67
- PPP2R5A S41
- PRKAA1 S496
- PRKCE S368
- PRKD2 S710
- PRKD2 S876
- PTPN1 S378
- PTPN12 S435
- RAF1 S43
- RASSF1 S207
- RRAD S273
- SLC9A3R1 S162
- SPN S351
- TAGLN S181
- VIM S5
- More...
Gene association
Number of significant genes with P-value ≤ 10-6 for each cohorts are summarized in bar plots. The scatter plot highlights significant associations diven by protein rather than mRNA abundance.
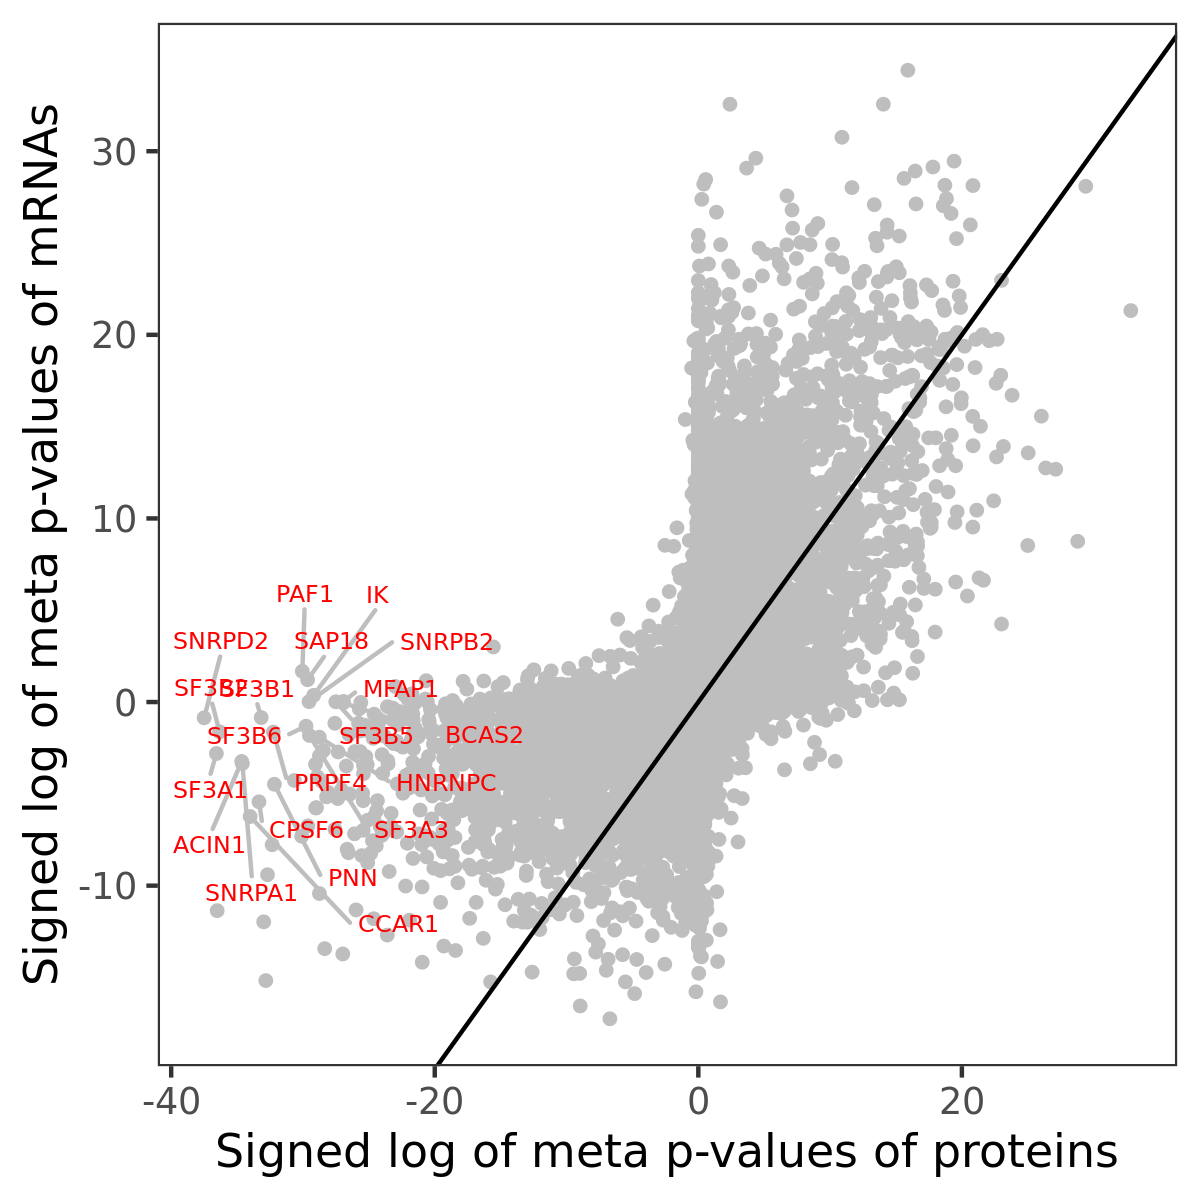
Association of protein abundance of genes
| Signed p-values | |||||||||||
|---|---|---|---|---|---|---|---|---|---|---|---|
| Gene | Meta P | BRCA | CCRCC | COAD | GBM | HNSCC | LSCC | LUAD | OV | PDAC | UCEC |
Gene set enrichment analysis
Submit genes and the common logarithm of the p-values of their association with KINASE-PSP_PKCA/PRKCA to WebGestalt.
Phosphosite association
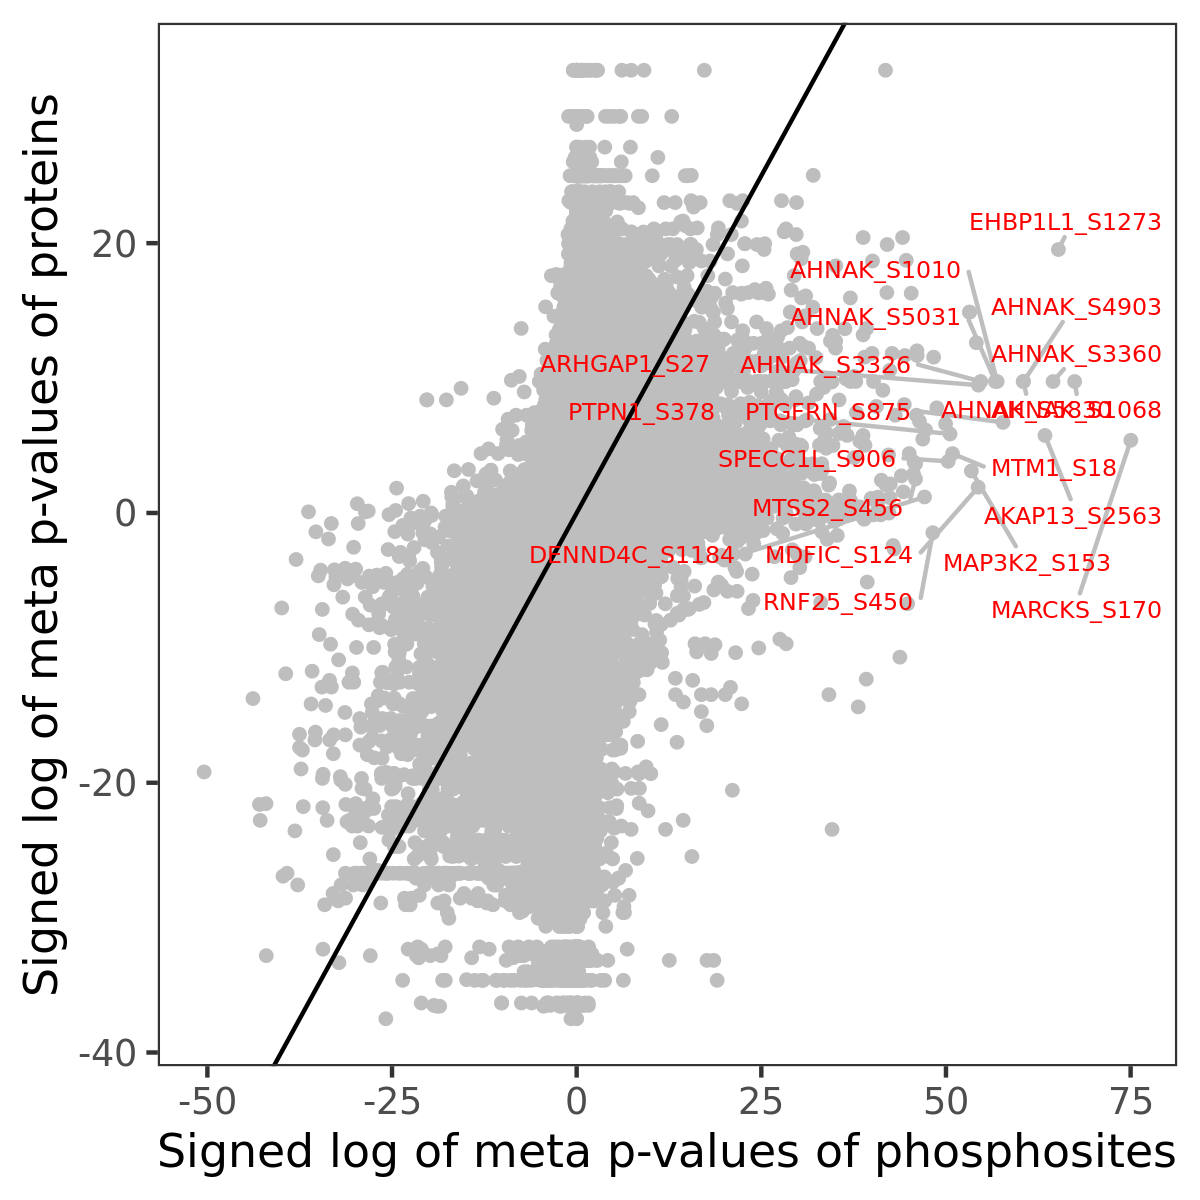
Number of significant genes with P-value ≤ 10-6 for each cohorts are summarized in the bar plot. The scatter plot highlights significant associations diven by phosphorylation rather than protein abundance.
| Signed p-values | |||||||||||||
|---|---|---|---|---|---|---|---|---|---|---|---|---|---|
| Gene | Protein | Site | Meta P | BRCA | CCRCC | COAD | GBM | HNSCC | LSCC | LUAD | OV | PDAC | UCEC |
Gene set enrichment analysis
Submit phosphorylation sites and the common logarithm of the p-values of their association with KINASE-PSP_PKCA/PRKCA to WebGestalt.