Basic information
- Phenotype
- PATH-NP_EGFR1_PATHWAY
- Description
- Enrichment score representing EGFR signaling activity. The score was calculated using PTM-SEA on the phosphoproteomics data.
- Source
- https://proteomics.broadapps.org/ptmsigdb/
- Method
- Phosphosite signature scores were calculated using the PTMsigDB v1.9.0 database and the ssGSEA2.0 R package (PMID: 30563849). The parameters were the same as those used for Hallmark pathway activity (sample.norm.type="rank", weight=0.75, statistic="area.under.RES", nperm=1000, min.overlap=10). Phosphoproteomics data were filtered to the fifteenmer phosphosites with complete data across all samples within a cohort. If there were multiple rows with complete data for identical fifteenmers, one row was selected at random. Each site was z-score transformed. Activity scores are normalized enrichment scores from ssGSEA.
- Genes
-
- ANXA1 Y39
- ATP1A1 Y260
- CRK Y251
- CRKL Y207
- EGFR S1064
- EGFR S1166
- EGFR T693
- EGFR S991
- EGFR S1039
- EIF4EBP1 S65
- EIF4EBP1 T70
- FOXO1 S256
- GSK3A S21
- GSK3B S9
- HIPK3 Y359
- INPPL1 S1003
- JUN S63
- KRT5 Y60
- LCK Y505
- MAPK1 Y187
- MAPK14 Y182
- MAPK3 Y204
- MAPK9 Y185
- NCK1 Y105
- NOS3 S114
- PIK3R1 Y580
- PLCG1 Y783
- PPP1R12A S472
- PRKCD Y313
- PRPF4B Y849
- PTK2 Y576
- PTK6 Y447
- PTPN11 Y62
- PTPN11 Y580
- PTPRA Y798
- PXN Y118
- PXN S85
- RAF1 S259
- SHC1 Y427
- STAT1 S727
- STAT3 S727
- STAT3 Y705
- TKT Y275
- TLN1 Y70
- TNS3 Y780
- TNS3 S776
- TYK2 Y292
- VCL Y822
- WASL Y256
- More...
Gene association
Number of significant genes with P-value ≤ 10-6 for each cohorts are summarized in bar plots. The scatter plot highlights significant associations diven by protein rather than mRNA abundance.
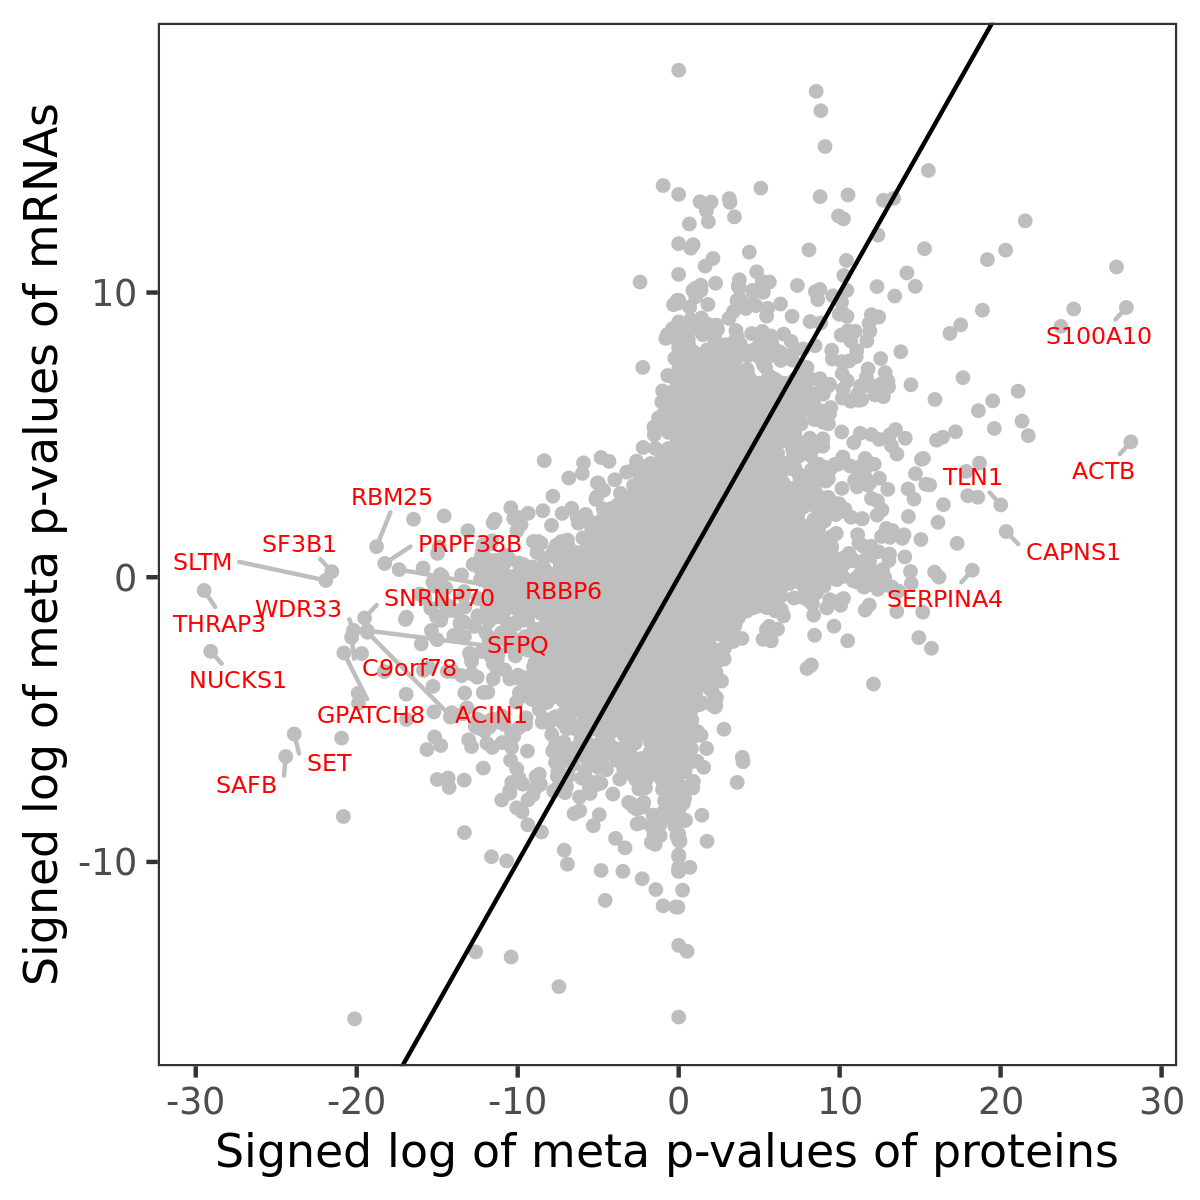
Association of protein abundance of genes
| Signed p-values | |||||||||||
|---|---|---|---|---|---|---|---|---|---|---|---|
| Gene | Meta P | BRCA | CCRCC | COAD | GBM | HNSCC | LSCC | LUAD | OV | PDAC | UCEC |
Gene set enrichment analysis
Submit genes and the common logarithm of the p-values of their association with PATH-NP_EGFR1_PATHWAY to WebGestalt.
Phosphosite association
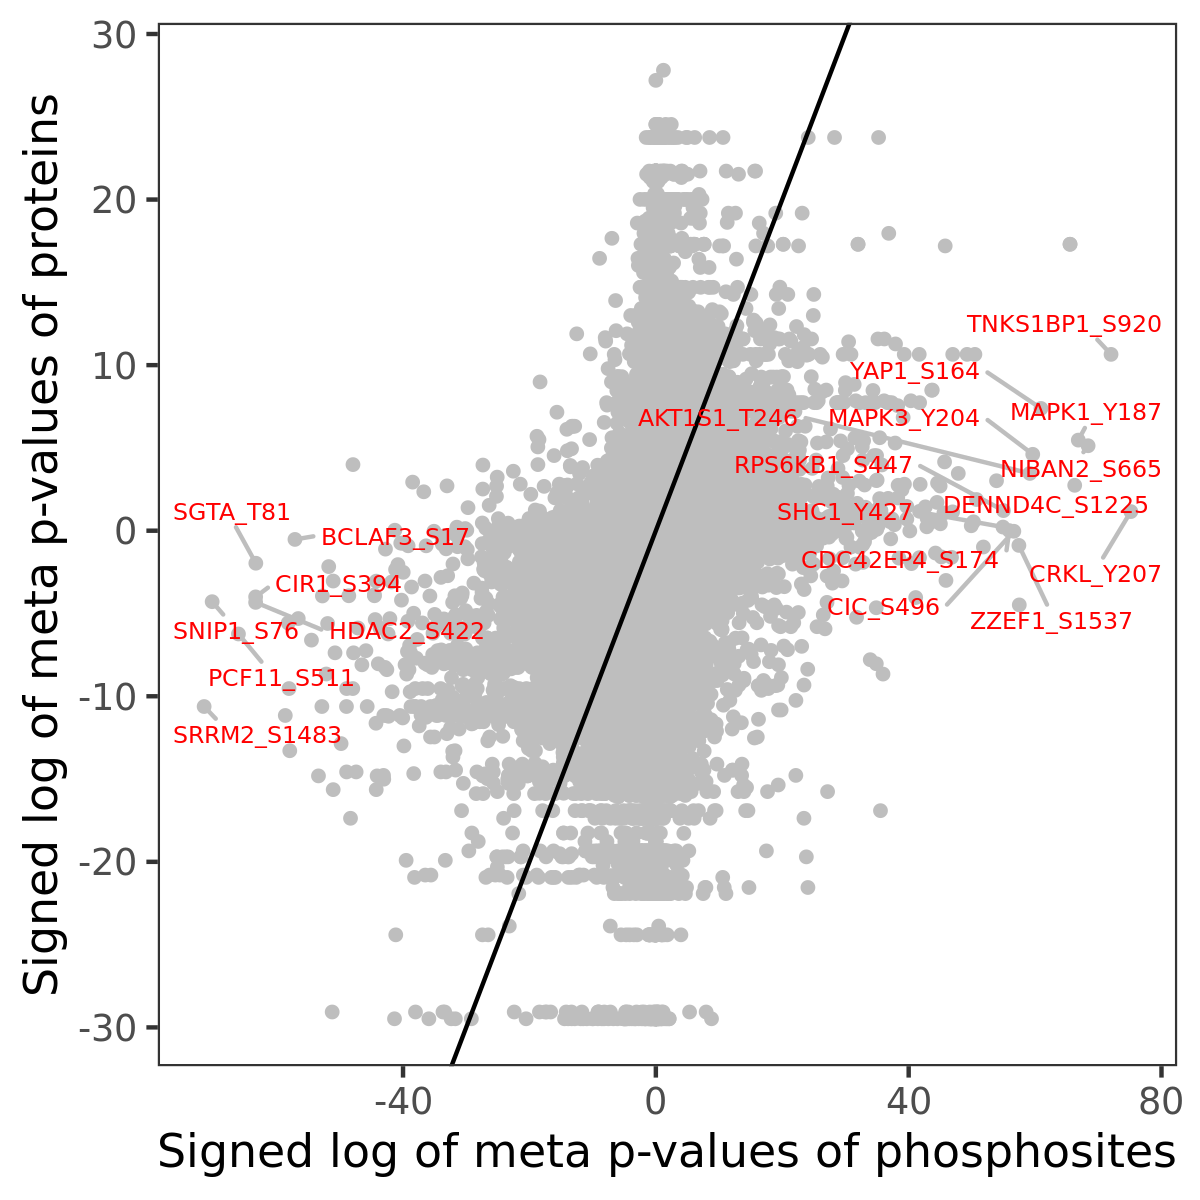
Number of significant genes with P-value ≤ 10-6 for each cohorts are summarized in the bar plot. The scatter plot highlights significant associations diven by phosphorylation rather than protein abundance.
| Signed p-values | |||||||||||||
|---|---|---|---|---|---|---|---|---|---|---|---|---|---|
| Gene | Protein | Site | Meta P | BRCA | CCRCC | COAD | GBM | HNSCC | LSCC | LUAD | OV | PDAC | UCEC |
Gene set enrichment analysis
Submit phosphorylation sites and the common logarithm of the p-values of their association with PATH-NP_EGFR1_PATHWAY to WebGestalt.