Basic information
- Phenotype
- PATH-NP_TSLP_PATHWAY
- Description
- Enrichment score representing TSLP signaling activity. The score was calculated using PTM-SEA on the phosphoproteomics data.
- Source
- https://proteomics.broadapps.org/ptmsigdb/
- Method
- Phosphosite signature scores were calculated using the PTMsigDB v1.9.0 database and the ssGSEA2.0 R package (PMID: 30563849). The parameters were the same as those used for Hallmark pathway activity (sample.norm.type="rank", weight=0.75, statistic="area.under.RES", nperm=1000, min.overlap=10). Phosphoproteomics data were filtered to the fifteenmer phosphosites with complete data across all samples within a cohort. If there were multiple rows with complete data for identical fifteenmers, one row was selected at random. Each site was z-score transformed. Activity scores are normalized enrichment scores from ssGSEA.
- Genes
-
- AGFG1 S181
- AKT1 S126
- APPL1 S401
- ARHGAP21 S924
- BRD4 S1117
- CAD S1859
- CAMSAP1 S1080
- CIC S496
- CTNND1 S268
- DLG1 S575
- EIF4EBP1 T70
- GATAD2B S334
- GATAD2B S338
- HCFC1 S598
- IRF2BPL S69
- KDM3B S798
- LCP1 S5
- LDLRAP1 S14
- LMNA S22
- MADD S1239
- MAPK1 Y187
- MAPK12 Y185
- MAPK14 T180
- MAPK14 Y182
- MAPK3 Y204
- MAPK9 Y185
- NAV1 S1000
- NCOA3 S857
- NUP153 S338
- PHF14 S290
- PI4K2A S47
- PICALM S16
- PRKCA S226
- PTPN11 Y542
- PUF60 T314
- PUM1 S209
- RBM39 S117
- RPS6 S235
- RPS6 S236
- SF3B2 S435
- SF3B2 S436
- SF3B2 S431
- SHC1 Y427
- SPRED1 S238
- SPTAN1 S1031
- SRRM2 S2272
- SRSF11 S207
- STAT3 S727
- STAT3 Y705
- STMN1 S25
- STMN1 S16
- TEX2 S266
- THOC5 T328
- UBE2O S839
- WDR33 S1219
- More...
Gene association
Number of significant genes with P-value ≤ 10-6 for each cohorts are summarized in bar plots. The scatter plot highlights significant associations diven by protein rather than mRNA abundance.
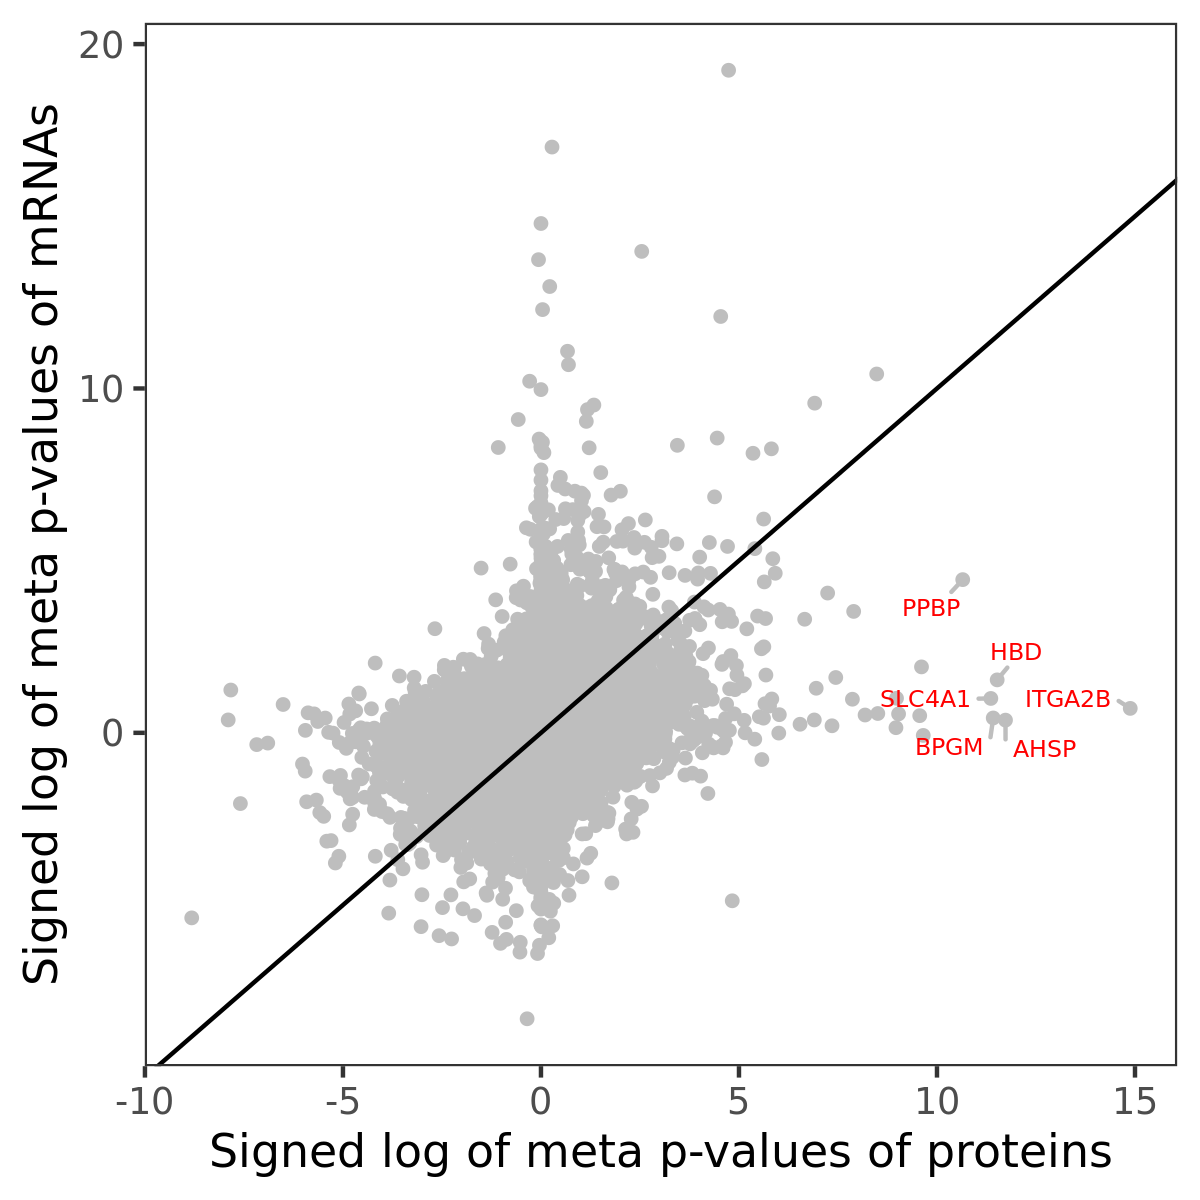
Association of protein abundance of genes
| Signed p-values | |||||||||||
|---|---|---|---|---|---|---|---|---|---|---|---|
| Gene | Meta P | BRCA | CCRCC | COAD | GBM | HNSCC | LSCC | LUAD | OV | PDAC | UCEC |
Gene set enrichment analysis
Submit genes and the common logarithm of the p-values of their association with PATH-NP_TSLP_PATHWAY to WebGestalt.
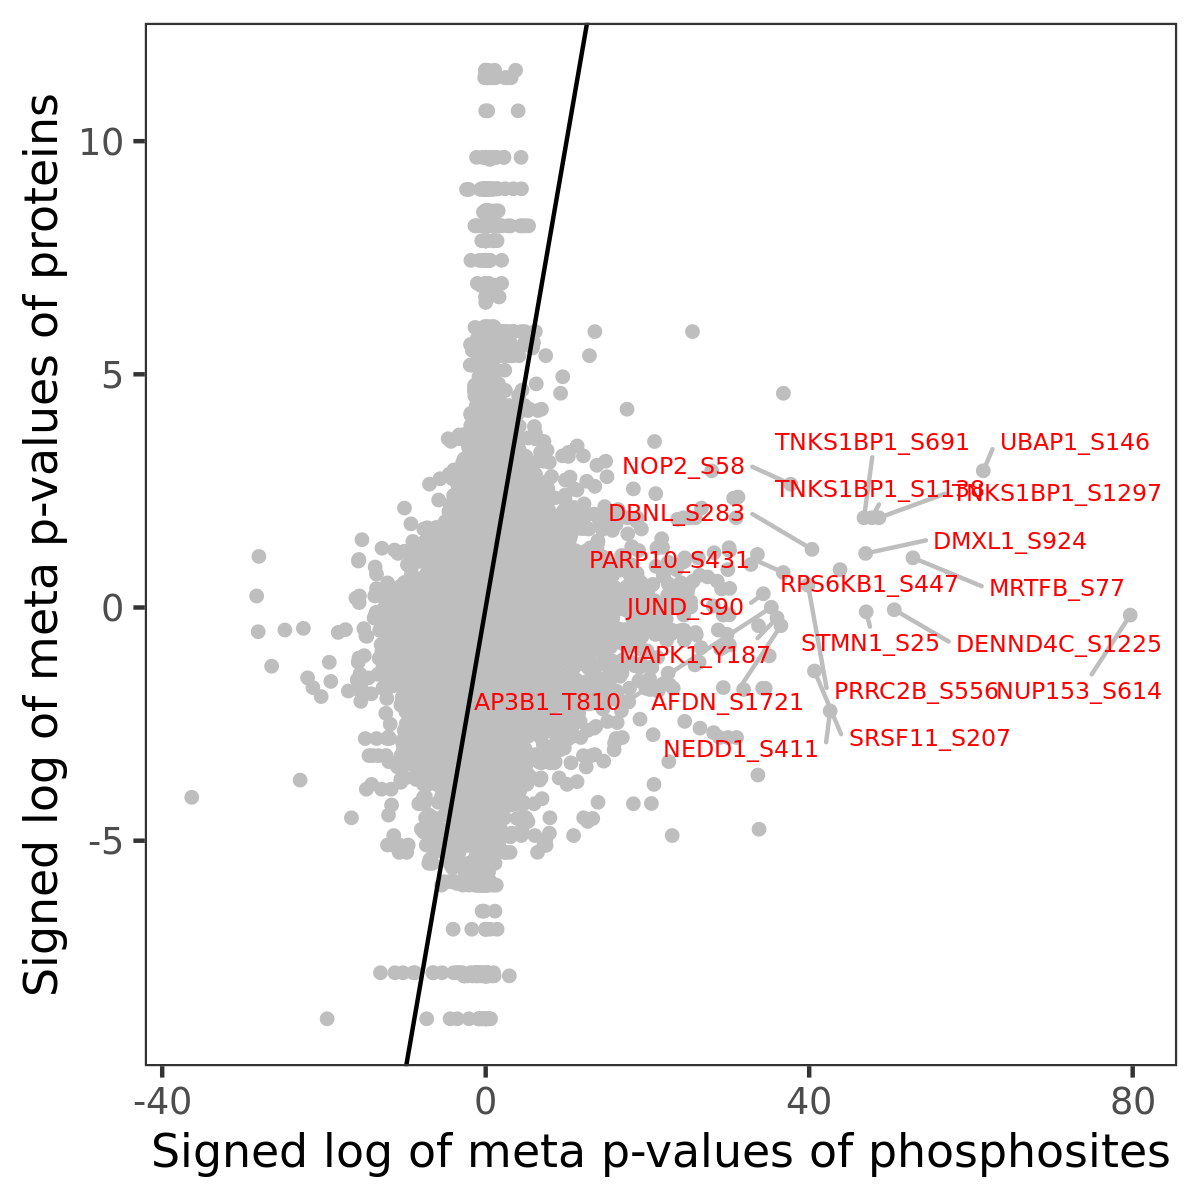
Phosphosite association
Number of significant genes with P-value ≤ 10-6 for each cohorts are summarized in the bar plot. The scatter plot highlights significant associations diven by phosphorylation rather than protein abundance.
| Signed p-values | |||||||||||||
|---|---|---|---|---|---|---|---|---|---|---|---|---|---|
| Gene | Protein | Site | Meta P | BRCA | CCRCC | COAD | GBM | HNSCC | LSCC | LUAD | OV | PDAC | UCEC |
Gene set enrichment analysis
Submit phosphorylation sites and the common logarithm of the p-values of their association with PATH-NP_TSLP_PATHWAY to WebGestalt.