Basic information
- Phenotype
- PERT-PSP_EGF
- Description
- Enrichment score representing phosphorylation alterations in response to EGF. The score was calculated using PTM-SEA on the phosphoproteomics data.
- Source
- https://proteomics.broadapps.org/ptmsigdb/
- Method
- Phosphosite signature scores were calculated using the PTMsigDB v1.9.0 database and the ssGSEA2.0 R package (PMID: 30563849). The parameters were the same as those used for Hallmark pathway activity (sample.norm.type="rank", weight=0.75, statistic="area.under.RES", nperm=1000, min.overlap=10). Phosphoproteomics data were filtered to the fifteenmer phosphosites with complete data across all samples within a cohort. If there were multiple rows with complete data for identical fifteenmers, one row was selected at random. Each site was z-score transformed. Activity scores are normalized enrichment scores from ssGSEA.
- Genes
-
- ABLIM3 S503
- AKT1S1 T246
- ANK3 S1459
- BAD S99
- CAD S1859
- CCDC88A S1417
- CD2AP S458
- CRK Y251
- CTNNB1 S552
- CTTN S418
- DENND1A S520
- DENND1A S523
- EGFR S991
- EGFR T693
- EPS15 S796
- GJA1 S279
- GSK3A S21
- GSK3B S9
- IRF2BP2 S240
- ITGB4 S1364
- JUN S63
- KRT8 S432
- LIFR S1044
- MAPK14 T180
- MAPK14 Y182
- MAPK7 T733
- MAPK9 Y185
- MYH9 S1943
- NIBAN2 S641
- PAK1 S144
- PDCD4 S457
- PHF3 S1925
- PLCG1 Y783
- PXN Y118
- RPS6 S240
- RPS6 S236
- RPS6 S235
- RPS6KA1 S380
- RPS6KA3 S386
- RPS6KA3 T365
- RPTOR S863
- SHC1 Y427
- SNTB2 S222
- SOS1 S1134
- SPAG9 T217
- SRRM2 S2272
- STAT1 S727
- STAT3 Y705
- STAT3 S727
- STMN1 S16
- STMN1 S25
- TNKS1BP1 S1385
- TNS3 Y780
- TNS3 S776
- TPR S2155
- More...
Gene association
Number of significant genes with P-value ≤ 10-6 for each cohorts are summarized in bar plots. The scatter plot highlights significant associations diven by protein rather than mRNA abundance.
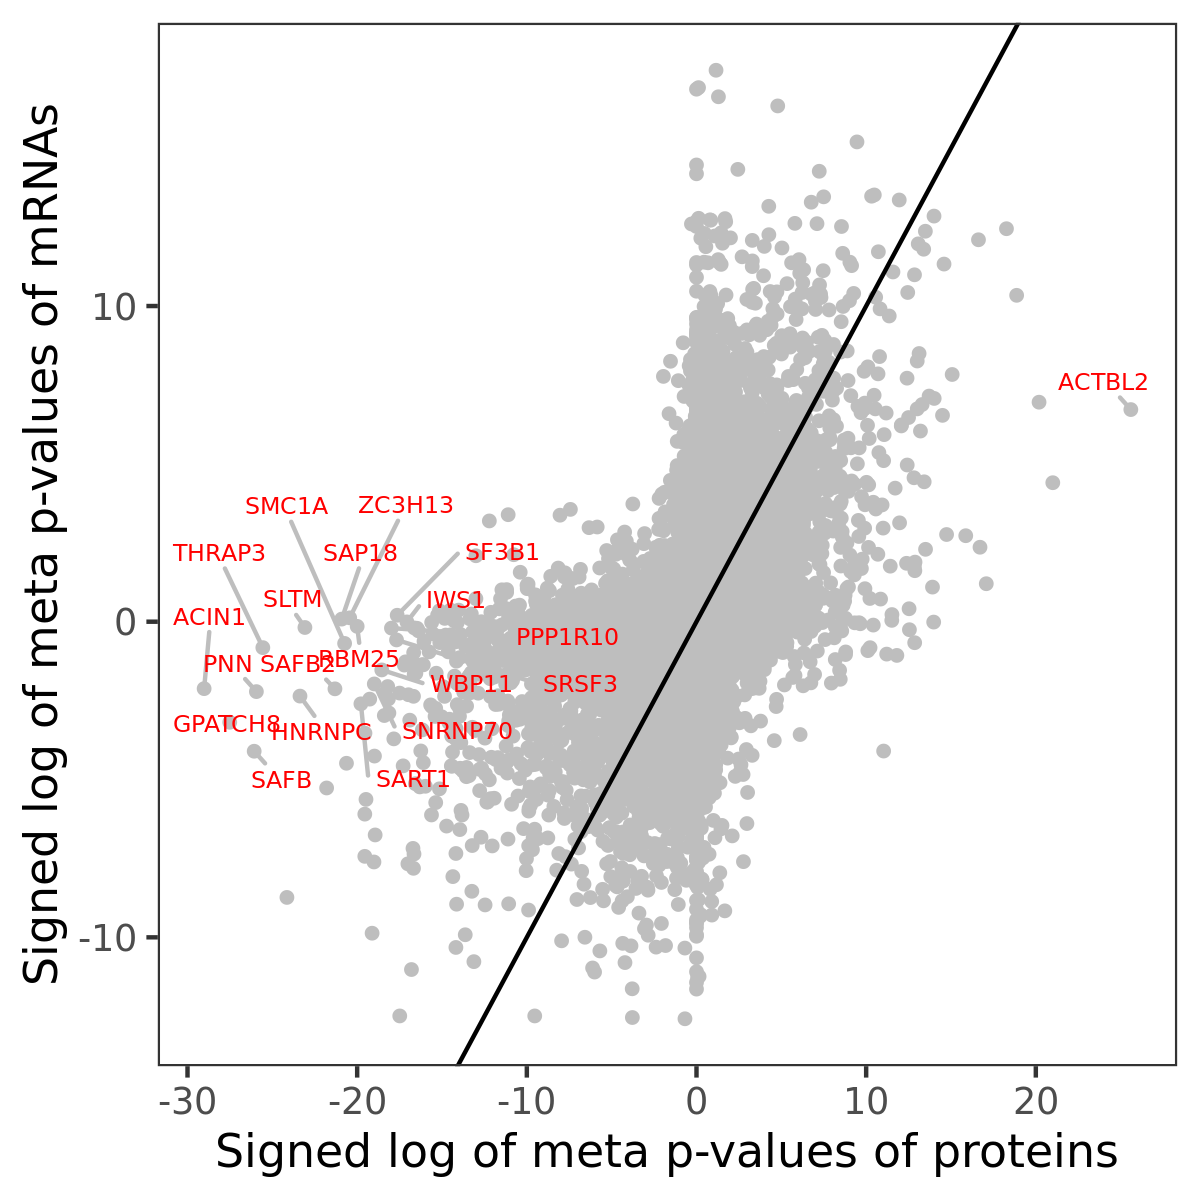
Association of protein abundance of genes
Signed p-values | ||||||||||||
|---|---|---|---|---|---|---|---|---|---|---|---|---|
Gene | Meta P | BRCA | CCRCC | COAD | GBM | HNSCC | LSCC | LUAD | OV | PDAC | UCEC | |
| No matching records found | ||||||||||||
Gene set enrichment analysis
Submit genes and the common logarithm of the p-values of their association with PERT-PSP_EGF to WebGestalt.
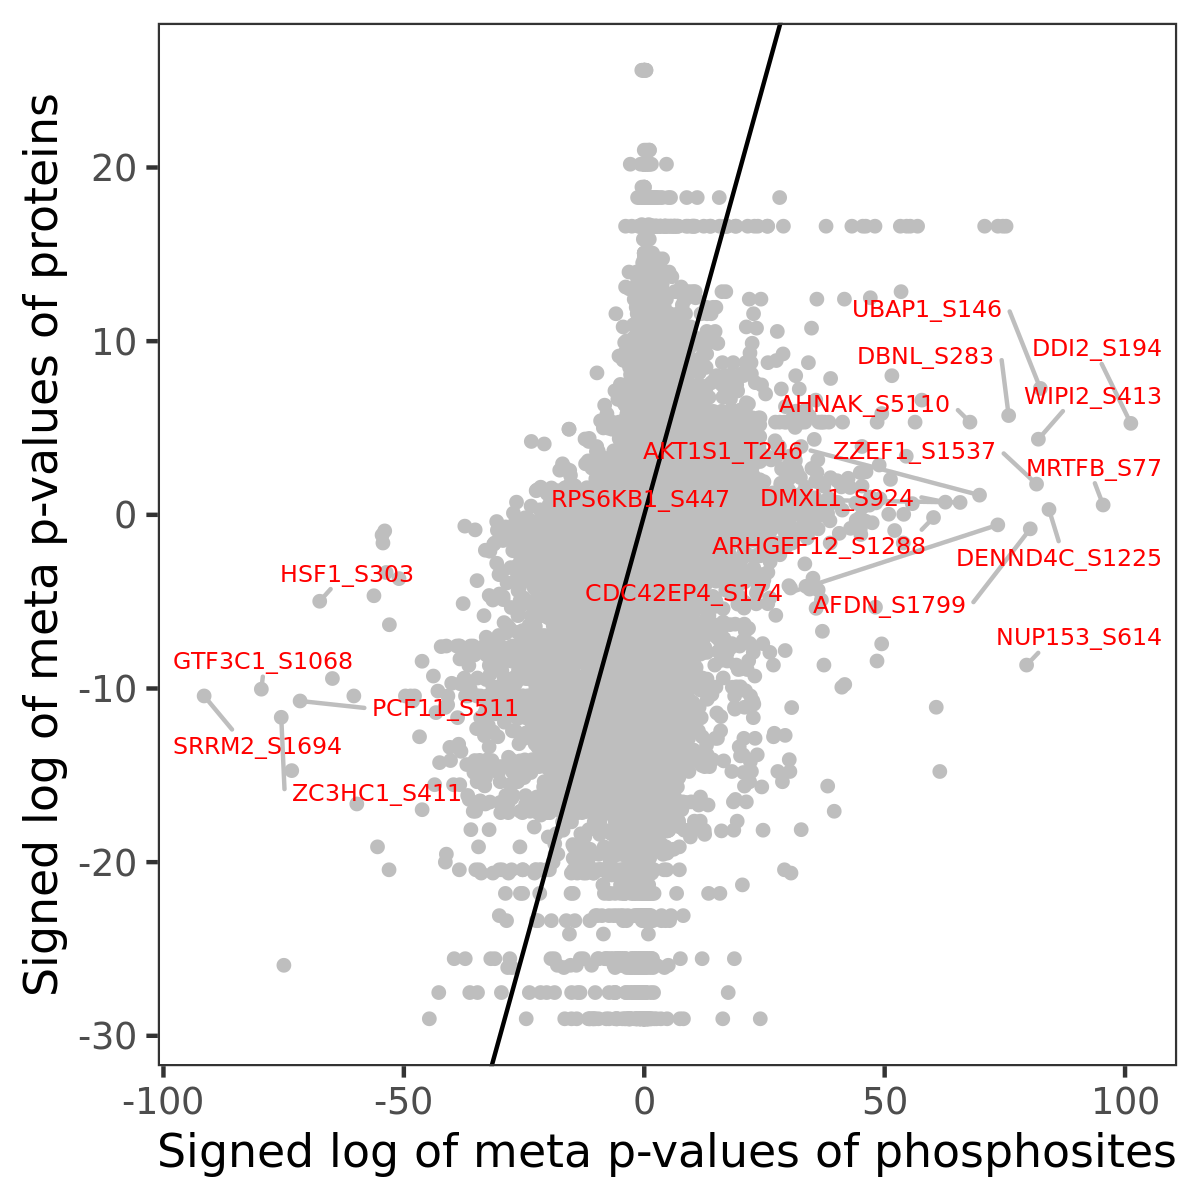
Phosphosite association
Number of significant genes with P-value ≤ 10-6 for each cohorts are summarized in the bar plot. The scatter plot highlights significant associations diven by phosphorylation rather than protein abundance.
Signed p-values | |||||||||||||
|---|---|---|---|---|---|---|---|---|---|---|---|---|---|
Gene | Protein | Site | Meta P | BRCA | CCRCC | COAD | GBM | HNSCC | LSCC | LUAD | OV | PDAC | UCEC |
| No matching records found | |||||||||||||
Gene set enrichment analysis
Submit phosphorylation sites and the common logarithm of the p-values of their association with PERT-PSP_EGF to WebGestalt.