Basic information
- Phenotype
- KINASE-PSP_CK2A1/CSNK2A1
- Description
- Enrichment score representing kinase activity of CK2A1. The score was calculated using PTM-SEA on the phosphoproteomics data.
- Source
- https://proteomics.broadapps.org/ptmsigdb/
- Method
- Phosphosite signature scores were calculated using the PTMsigDB v1.9.0 database and the ssGSEA2.0 R package (PMID: 30563849). The parameters were the same as those used for Hallmark pathway activity (sample.norm.type="rank", weight=0.75, statistic="area.under.RES", nperm=1000, min.overlap=10). Phosphoproteomics data were filtered to the fifteenmer phosphosites with complete data across all samples within a cohort. If there were multiple rows with complete data for identical fifteenmers, one row was selected at random. Each site was z-score transformed. Activity scores are normalized enrichment scores from ssGSEA.
- Genes
-
- ABCF1 S140
- AKT1 S129
- ANP32B T244
- ARNT S77
- CAV2 S36
- CCNH T315
- CLIP1 S1364
- CTDP1 S740
- CTNNA1 S641
- EEF1D S162
- EIF2S2 S67
- EIF3J S127
- EIF4G1 S1238
- EIF5 S389
- FGA S609
- G3BP1 S149
- HDAC1 S421
- HDAC2 S394
- HMGN1 S86
- HMGN1 S89
- HMGN1 S7
- HNRNPC S260
- HSP90AA1 S263
- HSP90AB1 S226
- HSP90AB1 S255
- IGF2R S2484
- IGF2R S2409
- JUN S243
- KDM1A S131
- L1CAM S1181
- MCM2 S108
- MCM2 S40
- MCM2 S139
- MCM2 S41
- MCM2 S27
- MDC1 S376
- MDC1 S329
- MDC1 S299
- MECOM S726
- MME S6
- MRE11 S689
- MRE11 S649
- MRE11 S688
- MYH10 S1975
- MYH10 S1956
- MYH9 S1943
- NASP S497
- NCAPG S973
- NCAPG S975
- NCF1 S348
- NCOA2 S493
- NCOA2 S499
- NCOR1 S2436
- NOL3 T149
- NR1H3 S198
- OTUB1 S16
- PAWR S231
- PDCD5 S119
- PDCL S296
- PDIA6 S428
- PKD2 S812
- PML S565
- PPP1R2 S87
- PTEN S385
- PTGES3 S113
- RAD9A S387
- RRAD S273
- SEPTIN2 S218
- SMC3 S1067
- SRPK1 S51
- SSB S366
- SSRP1 S657
- STARD10 S284
- STAT1 S727
- STX1A S14
- TLE1 S239
- TOP2A S1377
- TOP2A S1525
- USP7 S18
- VTN T76
- XPC S94
- YY1 S118
- More...
Gene association
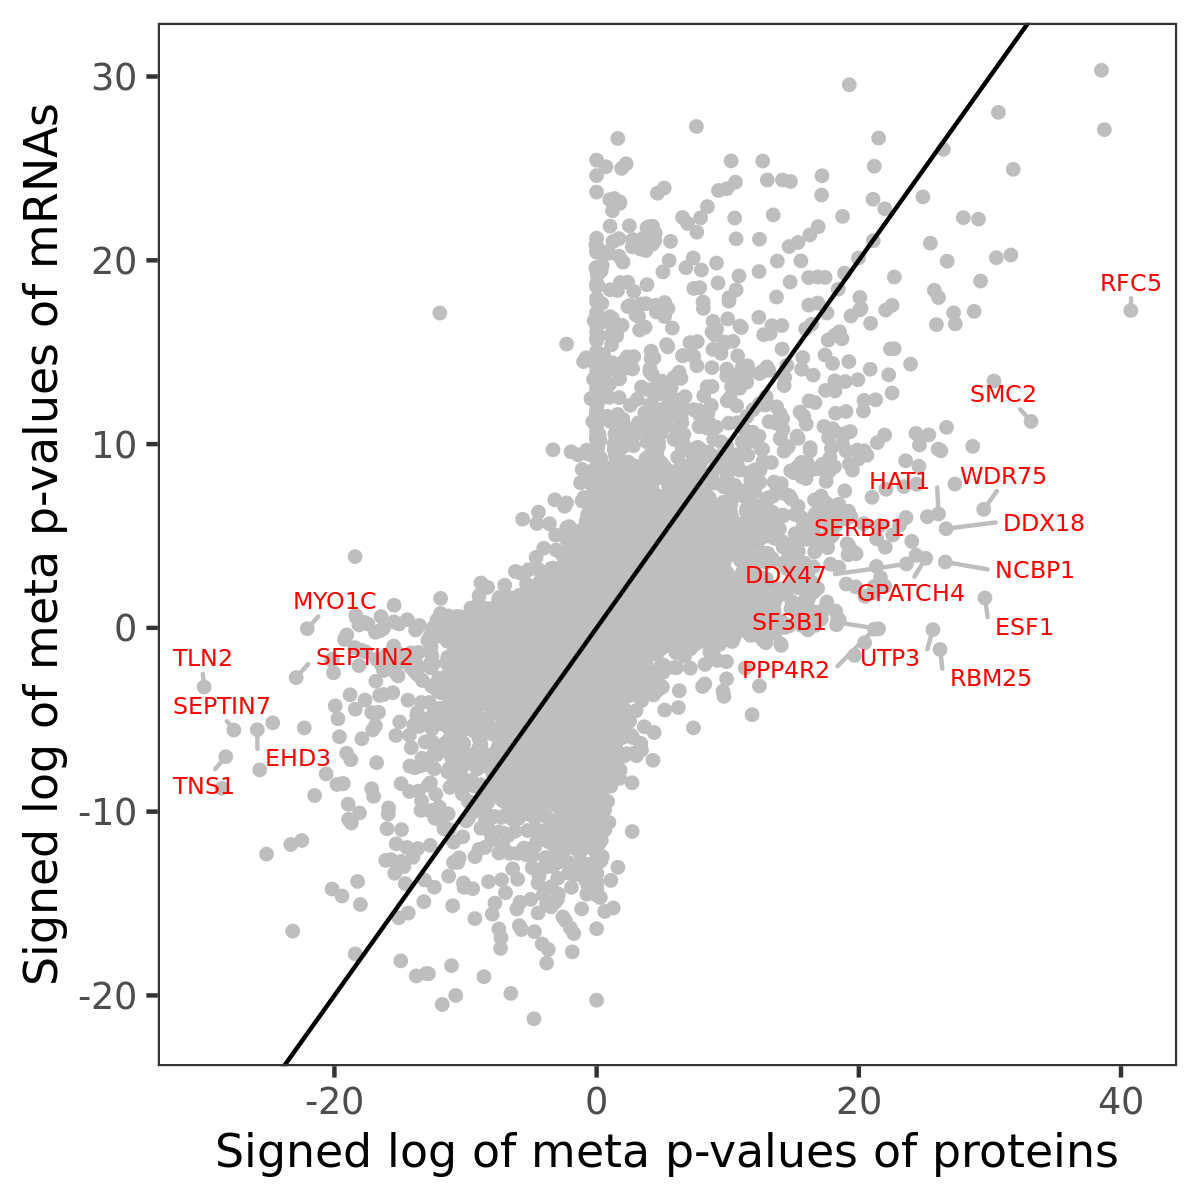
Number of significant genes with P-value ≤ 10-6 for each cohorts are summarized in bar plots. The scatter plot highlights significant associations diven by protein rather than mRNA abundance.

Association of protein abundance of genes
| Signed p-values | |||||||||||
|---|---|---|---|---|---|---|---|---|---|---|---|
| Gene | Meta P | BRCA | CCRCC | COAD | GBM | HNSCC | LSCC | LUAD | OV | PDAC | UCEC |
Gene set enrichment analysis
Submit genes and the common logarithm of the p-values of their association with KINASE-PSP_CK2A1/CSNK2A1 to WebGestalt.
Phosphosite association
Number of significant genes with P-value ≤ 10-6 for each cohorts are summarized in the bar plot. The scatter plot highlights significant associations diven by phosphorylation rather than protein abundance.

| Signed p-values | |||||||||||||
|---|---|---|---|---|---|---|---|---|---|---|---|---|---|
| Gene | Protein | Site | Meta P | BRCA | CCRCC | COAD | GBM | HNSCC | LSCC | LUAD | OV | PDAC | UCEC |
Gene set enrichment analysis
Submit phosphorylation sites and the common logarithm of the p-values of their association with KINASE-PSP_CK2A1/CSNK2A1 to WebGestalt.