Basic information
- Phenotype
- KINASE-PSP_ERK2/MAPK1
- Description
- Enrichment score representing kinase activity of ERK2. The score was calculated using PTM-SEA on the phosphoproteomics data.
- Source
- https://proteomics.broadapps.org/ptmsigdb/
- Method
- Phosphosite signature scores were calculated using the PTMsigDB v1.9.0 database and the ssGSEA2.0 R package (PMID: 30563849). The parameters were the same as those used for Hallmark pathway activity (sample.norm.type="rank", weight=0.75, statistic="area.under.RES", nperm=1000, min.overlap=10). Phosphoproteomics data were filtered to the fifteenmer phosphosites with complete data across all samples within a cohort. If there were multiple rows with complete data for identical fifteenmers, one row was selected at random. Each site was z-score transformed. Activity scores are normalized enrichment scores from ssGSEA.
- Genes
-
- ABI1 S225
- ADAM17 T735
- APBB1 T709
- ARHGEF2 T679
- ARRB1 S412
- BCL6 S333
- BCL6 S343
- BRAF T401
- CALD1 S789
- CDKN1A S130
- CDKN1B S178
- CDKN1B S10
- CIC S1409
- CTTN S405
- CTTN S418
- DNM1L S616
- EGFR T693
- EIF4EBP1 T70
- EIF4EBP1 S65
- EIF4G1 S1231
- ERBB2 T701
- ERF T526
- EXOC7 S250
- FOXO3 S294
- GORASP2 T222
- GORASP2 T225
- GRB10 S150
- HNRNPK S284
- IRS1 S636
- KDM4B S566
- LIFR S1044
- LRP6 S1490
- MAP2K1 T292
- MAPK7 T733
- MARCKS S46
- MBP T232
- MCRIP1 S21
- MYC S62
- MYLK S1779
- NCF1 S345
- NCOA1 S395
- NCOA2 S736
- NUP153 S320
- NUP153 S338
- NUP153 S522
- NUP153 S334
- NUP153 S529
- NUP153 S516
- NUP50 S221
- PGK1 S203
- PKM S37
- PLCB1 S982
- PML S527
- PML S530
- PRDX6 T177
- RBM17 T71
- RBM17 S222
- RPS6KB1 S447
- RPS6KB1 T444
- RPTOR S863
- RRAS2 S186
- SH2B1 S96
- SLC9A1 S693
- SLC9A1 S785
- SORBS3 S530
- SOS1 S1178
- SP1 S59
- SP3 S73
- STAT5A S780
- STIM1 S575
- TERF2 S365
- TOP2A S1393
- TOP2A S1247
- TOP2A S1213
- TPPP S18
- TSC2 S664
- TWIST1 S68
- More...
Gene association
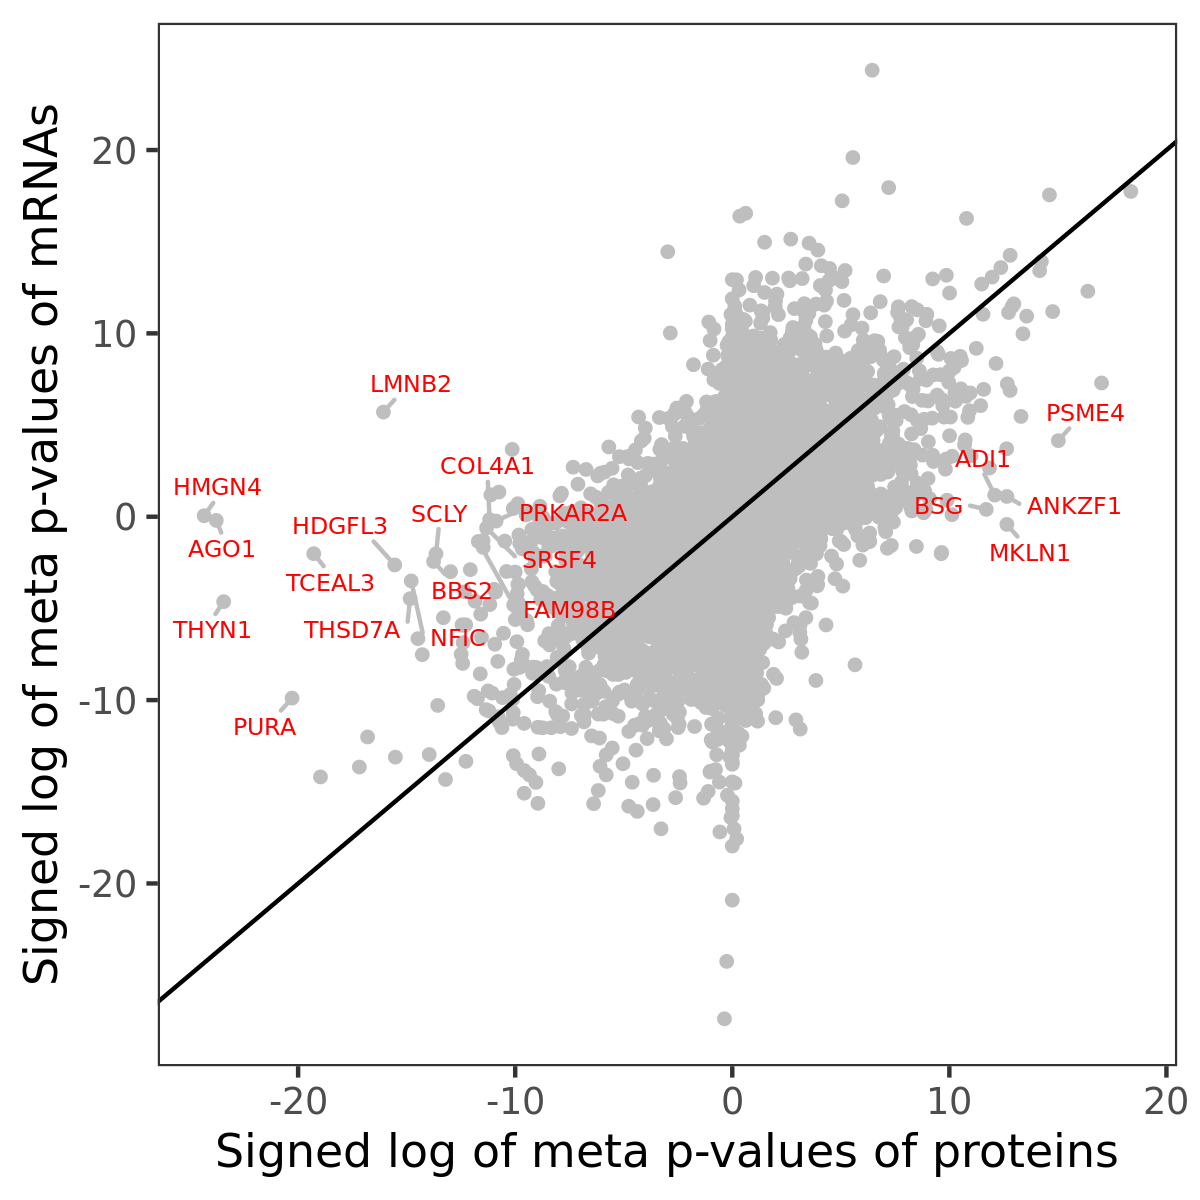
Number of significant genes with P-value ≤ 10-6 for each cohorts are summarized in bar plots. The scatter plot highlights significant associations diven by protein rather than mRNA abundance.

Association of protein abundance of genes
| Signed p-values | |||||||||||
|---|---|---|---|---|---|---|---|---|---|---|---|
| Gene | Meta P | BRCA | CCRCC | COAD | GBM | HNSCC | LSCC | LUAD | OV | PDAC | UCEC |
Gene set enrichment analysis
Submit genes and the common logarithm of the p-values of their association with KINASE-PSP_ERK2/MAPK1 to WebGestalt.
Phosphosite association
Number of significant genes with P-value ≤ 10-6 for each cohorts are summarized in the bar plot. The scatter plot highlights significant associations diven by phosphorylation rather than protein abundance.

| Signed p-values | |||||||||||||
|---|---|---|---|---|---|---|---|---|---|---|---|---|---|
| Gene | Protein | Site | Meta P | BRCA | CCRCC | COAD | GBM | HNSCC | LSCC | LUAD | OV | PDAC | UCEC |
Gene set enrichment analysis
Submit phosphorylation sites and the common logarithm of the p-values of their association with KINASE-PSP_ERK2/MAPK1 to WebGestalt.