Basic information
- Phenotype
- KINASE-PSP_PKACA/PRKACA
- Description
- Enrichment score representing kinase activity of PKA. The score was calculated using PTM-SEA on the phosphoproteomics data.
- Source
- https://proteomics.broadapps.org/ptmsigdb/
- Method
- Phosphosite signature scores were calculated using the PTMsigDB v1.9.0 database and the ssGSEA2.0 R package (PMID: 30563849). The parameters were the same as those used for Hallmark pathway activity (sample.norm.type="rank", weight=0.75, statistic="area.under.RES", nperm=1000, min.overlap=10). Phosphoproteomics data were filtered to the fifteenmer phosphosites with complete data across all samples within a cohort. If there were multiple rows with complete data for identical fifteenmers, one row was selected at random. Each site was z-score transformed. Activity scores are normalized enrichment scores from ssGSEA.
- Genes
-
- AKAP12 S627
- AKAP13 S1565
- APPL1 S410
- AQP2 S256
- AQP4 S276
- ARHGEF6 S684
- ATR S435
- ATXN1 S775
- BAD S118
- BAD S99
- CAD S1859
- CAD S1406
- CAMKK1 S475
- CBX3 S93
- CD44 S697
- CDK16 S153
- CDK16 S12
- CDK16 S110
- CDK16 S119
- CFTR S660
- CFTR S737
- CTNNB1 S675
- CTNNB1 S552
- DNAJC5 S10
- EMD S49
- ETV1 S191
- FCER1G S69
- FLNA S2152
- FXYD1 S83
- FYN S21
- GFAP S13
- GFAP T7
- GFAP S38
- GSK3A S21
- GSK3B S9
- HSPB1 T143
- HSPB1 S82
- HSPB1 S78
- HSPB6 S16
- ITGA4 S1021
- ITGB4 S1364
- KCNQ1 S27
- LASP1 S146
- LCP1 S5
- LRP1 S4520
- MAP2 S1782
- MARK3 T507
- MYLK S1773
- NCF1 S320
- NCOA3 S857
- NDE1 S306
- NDRG1 S330
- NF2 S518
- NFATC1 S269
- NOS3 S633
- PDE3A S428
- PDE3A S312
- PDE3B S318
- PFKFB2 S466
- PFKFB3 S461
- PLCB3 S1105
- PLCG1 S1248
- PLEC S4642
- PLN S16
- POLD3 S458
- PPP1R1A S67
- PPP1R1B T34
- PPP2R5D S573
- PREX1 S436
- PRKAR2B S114
- PSMD11 S14
- PTBP1 S16
- PTPN12 S435
- PTPN7 S149
- RAF1 S259
- RAF1 S43
- RASGRP2 S587
- RASSF1 S207
- RB1 S780
- RRAD S273
- SIK2 S358
- SLC8B1 S258
- SRC S17
- STK26 T178
- STMN1 S63
- STMN1 S16
- SUN2 S12
- SUN2 S116
- TAGLN2 S163
- TGM2 S216
- TPPP S32
- URI1 S372
- USP20 S333
- VASP S239
- VIM S72
- VIM S73
- VIM S39
- ZFP36L1 S54
- More...
Gene association
Number of significant genes with P-value ≤ 10-6 for each cohorts are summarized in bar plots. The scatter plot highlights significant associations diven by protein rather than mRNA abundance.
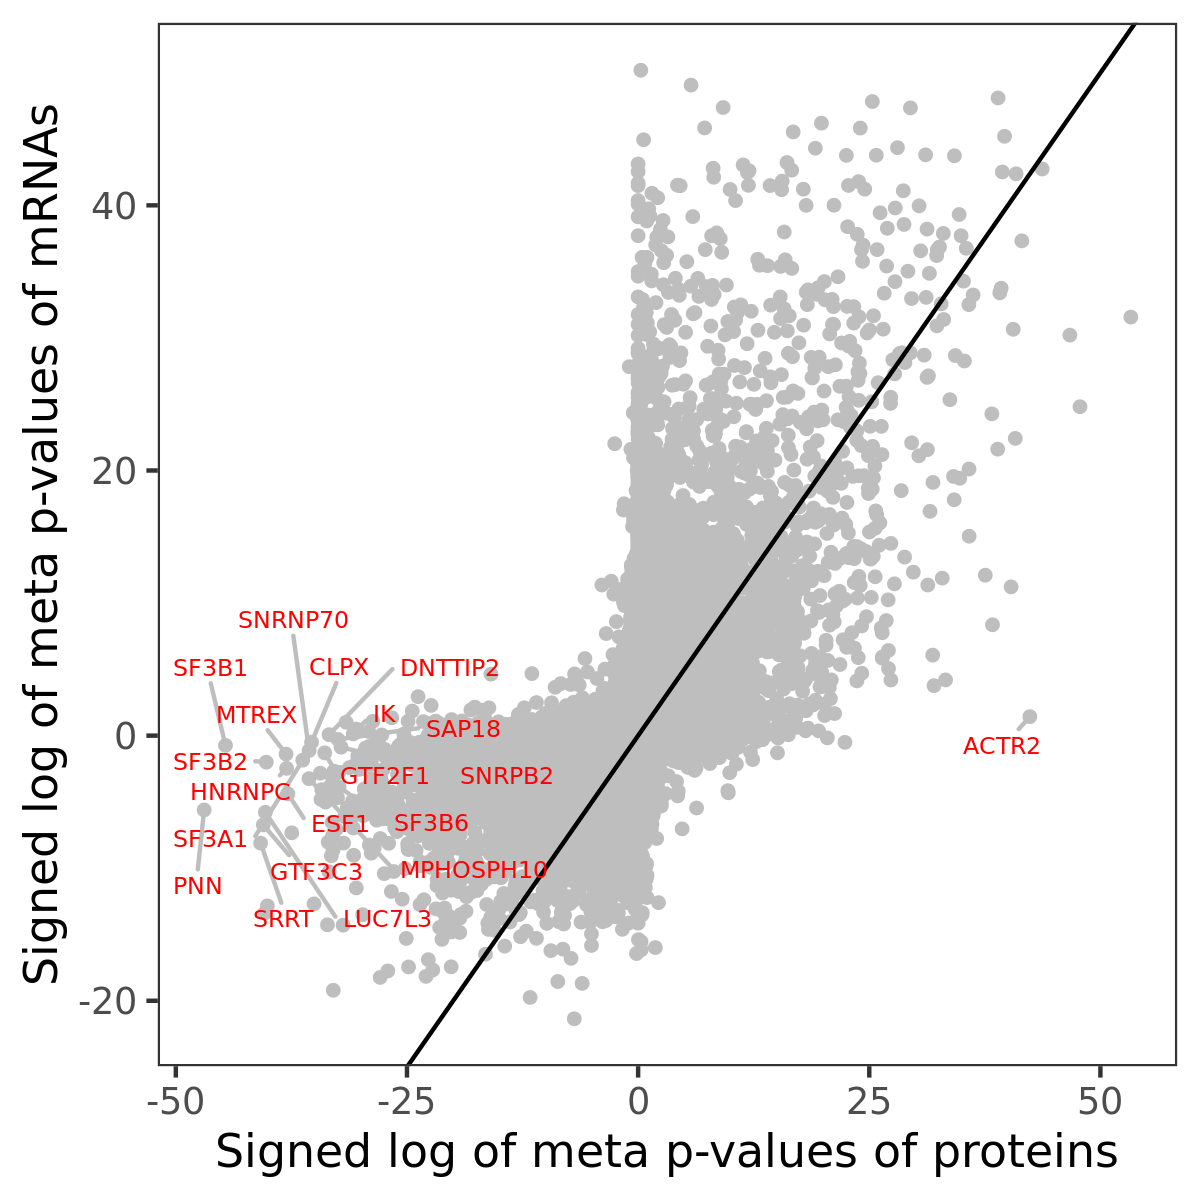
Association of protein abundance of genes
Signed p-values | ||||||||||||
|---|---|---|---|---|---|---|---|---|---|---|---|---|
Gene | Meta P | BRCA | CCRCC | COAD | GBM | HNSCC | LSCC | LUAD | OV | PDAC | UCEC | |
| No matching records found | ||||||||||||
Gene set enrichment analysis
Submit genes and the common logarithm of the p-values of their association with KINASE-PSP_PKACA/PRKACA to WebGestalt.
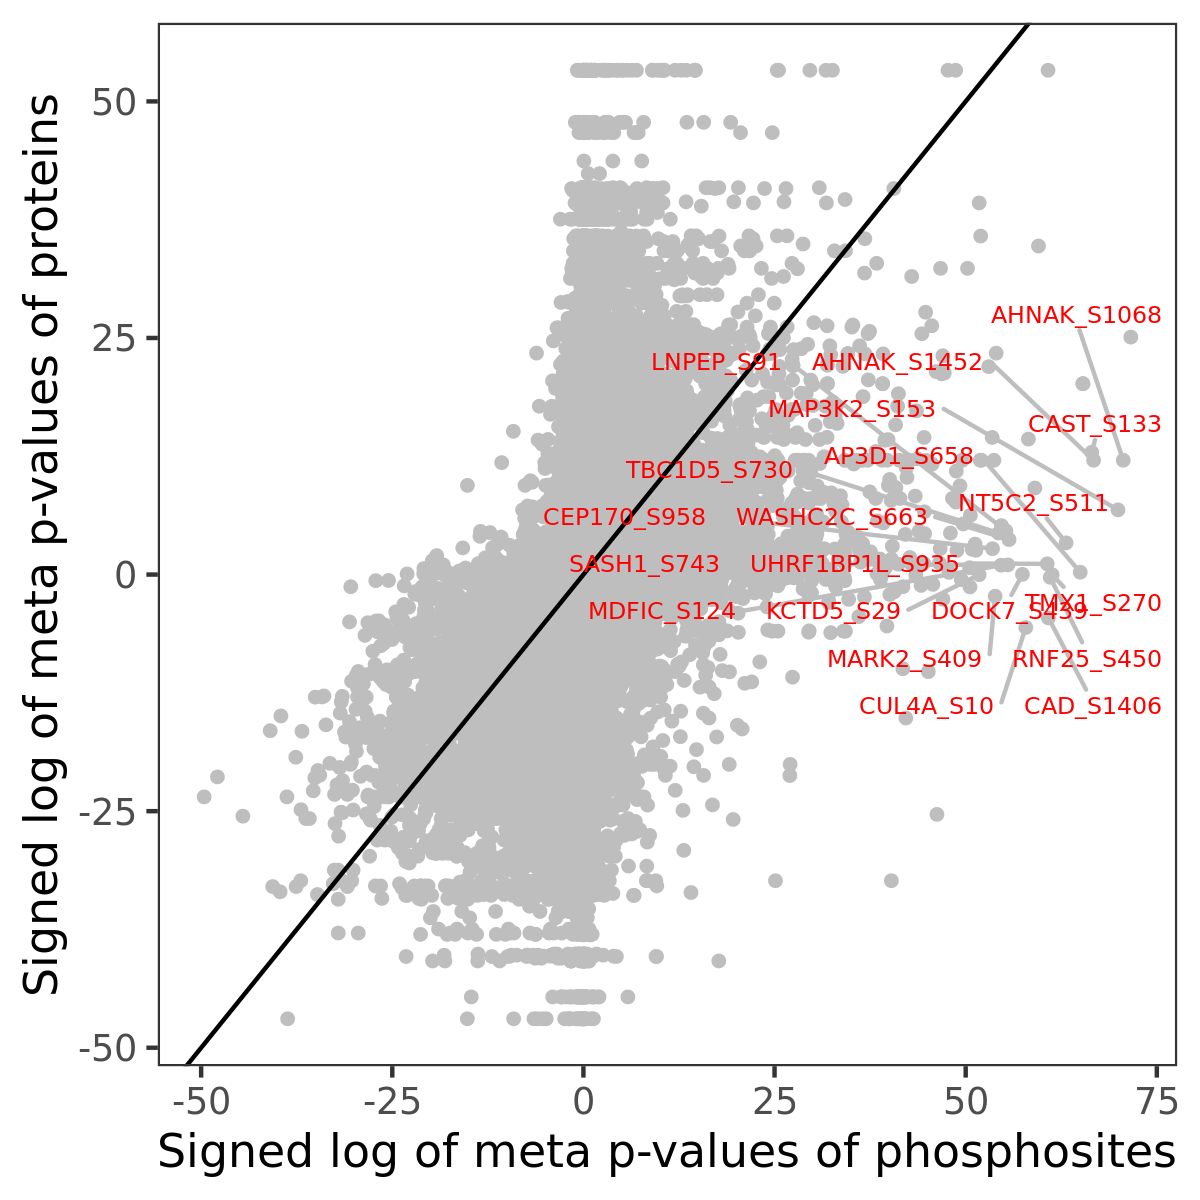
Phosphosite association
Number of significant genes with P-value ≤ 10-6 for each cohorts are summarized in the bar plot. The scatter plot highlights significant associations diven by phosphorylation rather than protein abundance.
Signed p-values | |||||||||||||
|---|---|---|---|---|---|---|---|---|---|---|---|---|---|
Gene | Protein | Site | Meta P | BRCA | CCRCC | COAD | GBM | HNSCC | LSCC | LUAD | OV | PDAC | UCEC |
| No matching records found | |||||||||||||
Gene set enrichment analysis
Submit phosphorylation sites and the common logarithm of the p-values of their association with KINASE-PSP_PKACA/PRKACA to WebGestalt.