Basic information
- Phenotype
- KINASE-PSP_CDK2
- Description
- Enrichment score representing kinase activity of CDK2. The score was calculated using PTM-SEA on the phosphoproteomics data.
- Source
- https://proteomics.broadapps.org/ptmsigdb/
- Method
- Phosphosite signature scores were calculated using the PTMsigDB v1.9.0 database and the ssGSEA2.0 R package (PMID: 30563849). The parameters were the same as those used for Hallmark pathway activity (sample.norm.type="rank", weight=0.75, statistic="area.under.RES", nperm=1000, min.overlap=10). Phosphoproteomics data were filtered to the fifteenmer phosphosites with complete data across all samples within a cohort. If there were multiple rows with complete data for identical fifteenmers, one row was selected at random. Each site was z-score transformed. Activity scores are normalized enrichment scores from ssGSEA.
- Genes
-
- AFDN T1352
- AKIRIN2 S21
- ANKLE2 S528
- ANKRD17 S2401
- ARID1A S363
- ARID4A S1140
- ARID4A S864
- ATRIP S224
- CALD1 T730
- CCDC6 S244
- CCNE1 S387
- CDK16 S138
- CDK7 S164
- CDK7 T170
- CDKN1A S130
- CENPA S19
- CRMP1 T509
- CROCC S1460
- CRTC2 S433
- CTTN S405
- DLG1 S158
- DNM1L S616
- DNMT1 S154
- EIF4A3 T163
- ELAVL1 S202
- FAM122A S143
- FOXK2 S373
- FOXK2 S428
- GIGYF2 S30
- GIGYF2 S593
- GORASP2 T225
- GRK2 S670
- H1-4 T18
- HIRA T555
- HMGA1 S36
- HNRNPK S216
- ILRUN S215
- JPT2 S97
- LARP1 T572
- LARP1 S697
- LIG1 S51
- LIG1 S76
- LIG3 S210
- LIG3 S913
- LMNB2 S37
- MCM2 S139
- MCM2 S40
- MCM2 S27
- MCM2 S41
- MCM2 S108
- MCM3 T722
- MCM4 T110
- MED1 T1215
- MKI67 S357
- MTA1 S522
- NBN S432
- NCAPH T49
- NCL T76
- NCL T121
- NPM1 S70
- NPM1 T199
- NUCKS1 S181
- NUP98 S612
- ORC2 T226
- PAICS S27
- PELP1 S477
- PGR S400
- PGR S162
- PML S518
- PPP1CA T320
- PPP1R12C S509
- PRKAR1A S83
- PTPN12 S19
- PTPN2 S304
- RAD18 S99
- RAD9A S328
- RALY S135
- RB1 T356
- RB1 T373
- RB1 S807
- RB1 S249
- RB1 T821
- RB1 T826
- RBBP8 T315
- RBL1 S650
- RBL2 S1080
- RBL2 S952
- RBL2 S639
- RBL2 S1112
- RBL2 S1068
- RPL12 S38
- RRM2 S20
- SAMHD1 T592
- SCML2 S511
- SETDB1 S1066
- SF3B1 T313
- SF3B1 T244
- SF3B1 T211
- SF3B1 T142
- SF3B1 T426
- SIRT2 S368
- SLAIN2 S48
- SNAPIN S133
- SNRNP70 S226
- STMN1 S38
- STMN1 S25
- SUPT5H S666
- SUPT6H T1523
- TERF2 S365
- TERF2IP S203
- THRAP3 T874
- TNKS1BP1 S691
- TOR1AIP1 S143
- TP53 S315
- UBE2O S836
- WRN S1133
- XRCC6 T455
- More...
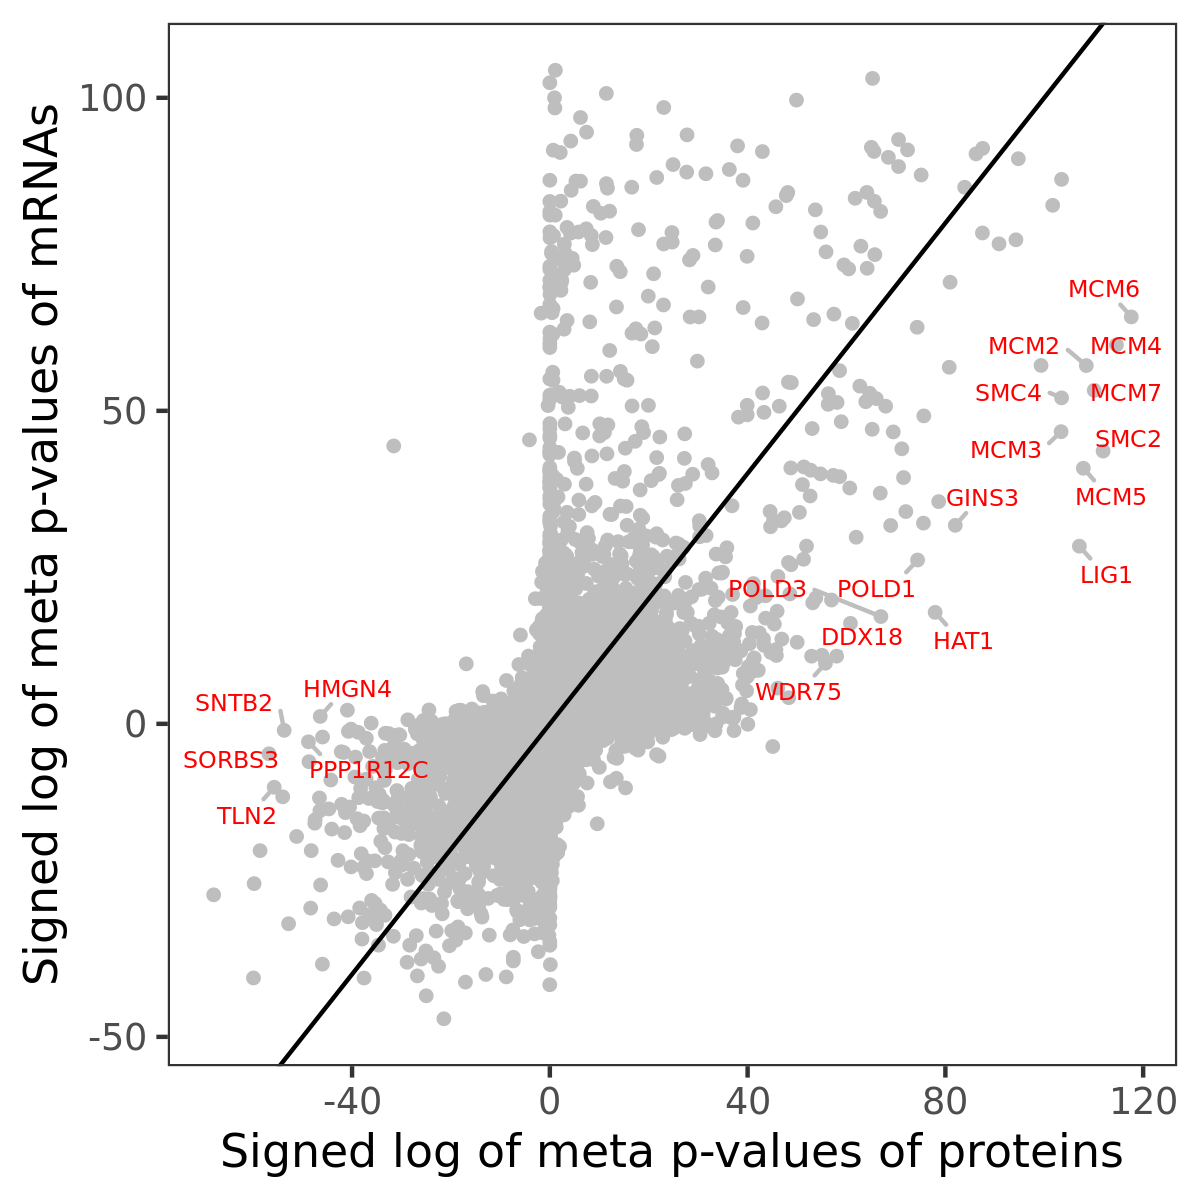
Gene association
Number of significant genes with P-value ≤ 10-6 for each cohorts are summarized in bar plots. The scatter plot highlights significant associations diven by protein rather than mRNA abundance.

Association of protein abundance of genes
Signed p-values | ||||||||||||
|---|---|---|---|---|---|---|---|---|---|---|---|---|
Gene | Meta P | BRCA | CCRCC | COAD | GBM | HNSCC | LSCC | LUAD | OV | PDAC | UCEC | |
| No matching records found | ||||||||||||
Gene set enrichment analysis
Submit genes and the common logarithm of the p-values of their association with KINASE-PSP_CDK2 to WebGestalt.
Phosphosite association
Number of significant genes with P-value ≤ 10-6 for each cohorts are summarized in the bar plot. The scatter plot highlights significant associations diven by phosphorylation rather than protein abundance.

Signed p-values | |||||||||||||
|---|---|---|---|---|---|---|---|---|---|---|---|---|---|
Gene | Protein | Site | Meta P | BRCA | CCRCC | COAD | GBM | HNSCC | LSCC | LUAD | OV | PDAC | UCEC |
| No matching records found | |||||||||||||
Gene set enrichment analysis
Submit phosphorylation sites and the common logarithm of the p-values of their association with KINASE-PSP_CDK2 to WebGestalt.